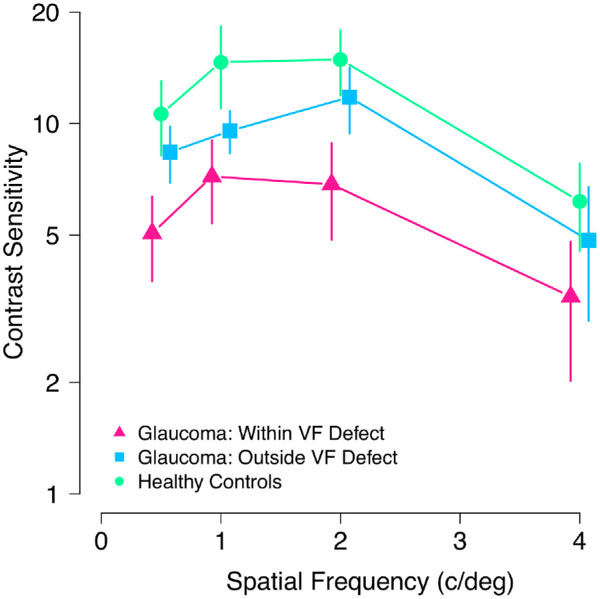
Figure 2.

Mean contrast sensitivity for healthy control participants (green circles) and participants with glaucoma within their visual field (VF) defect (pink triangles) and outside of their visual field defect (blue squares). Error bars show 95% confidence interval of the mean.
