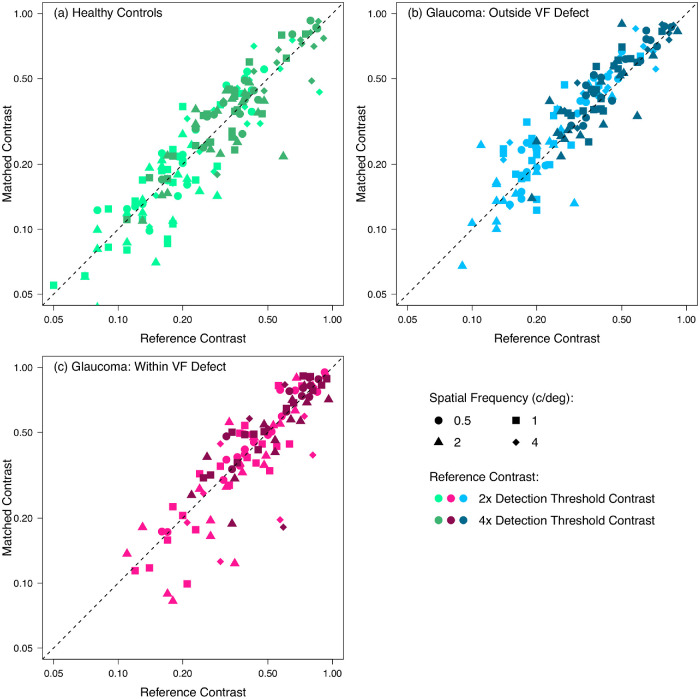
Figure 4.
Contrast matches for individual participants in each experimental condition. Data are shown for (a) healthy control participants, (b) participants with glaucoma outside their visual field (VF) defect, and (c) participants with glaucoma within their visual field defect. Dashed 1:1 lines indicate perceived contrast matching physical contrast. Lighter plotting symbols indicate reference contrasts of two times the detection threshold, and darker plotting symbols indicate reference contrasts of four times the detection threshold.

