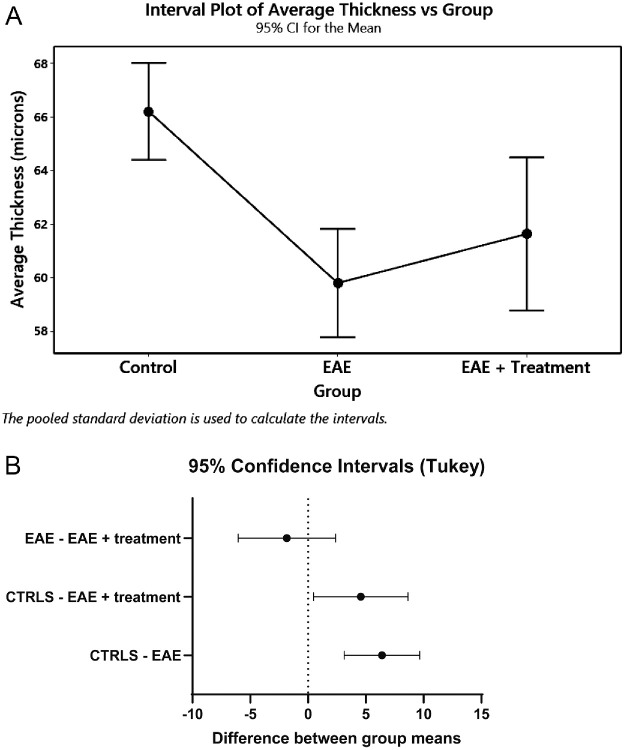
Figure 1.
Subject average retinal thickness (in µm). Visualizations of results. (A) Plot of group means and their 95% confidence intervals. Confidence intervals are not adjusted for multiple comparisons. Analysis with Minitab. (B) Plot of pairwise differences and their Tukey-adjusted confidence intervals. Analysis with GraphPad Prism 8.

