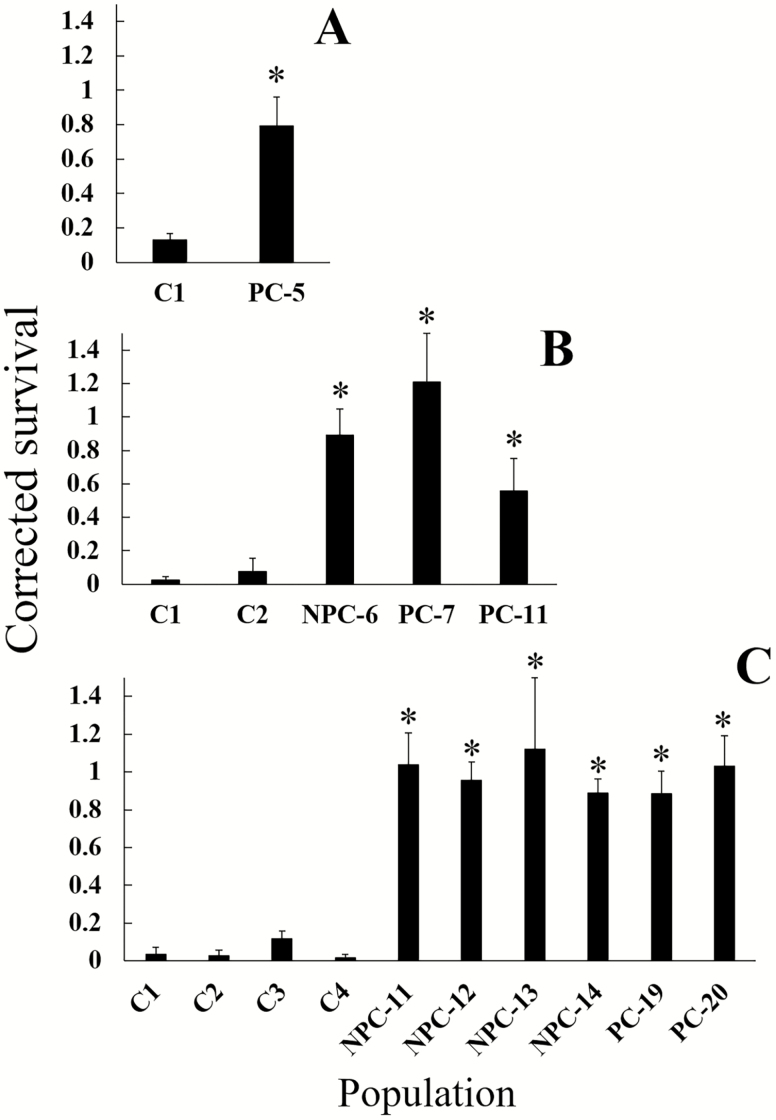
Fig. 5.
Corrected survival for all populations assayed on non-Bt and Cry3Bb1 corn. A = 2015; B = 2016; C = 2017. Corrected survival was calculated as proportion of larvae surviving on Cry3Bb1 corn in a replicate ÷ mean proportion surviving larvae on non-Bt corn in all replicates of a population. For field labels, ‘PC’ and ‘NPC’ prefixes denote problem- and non-problem county fields. Bar heights are means for corrected survival for a population, and error bars are standard error of the mean. Asterisks indicate that corrected survival in the population was significantly higher than the controls in the year the assay was conducted.

