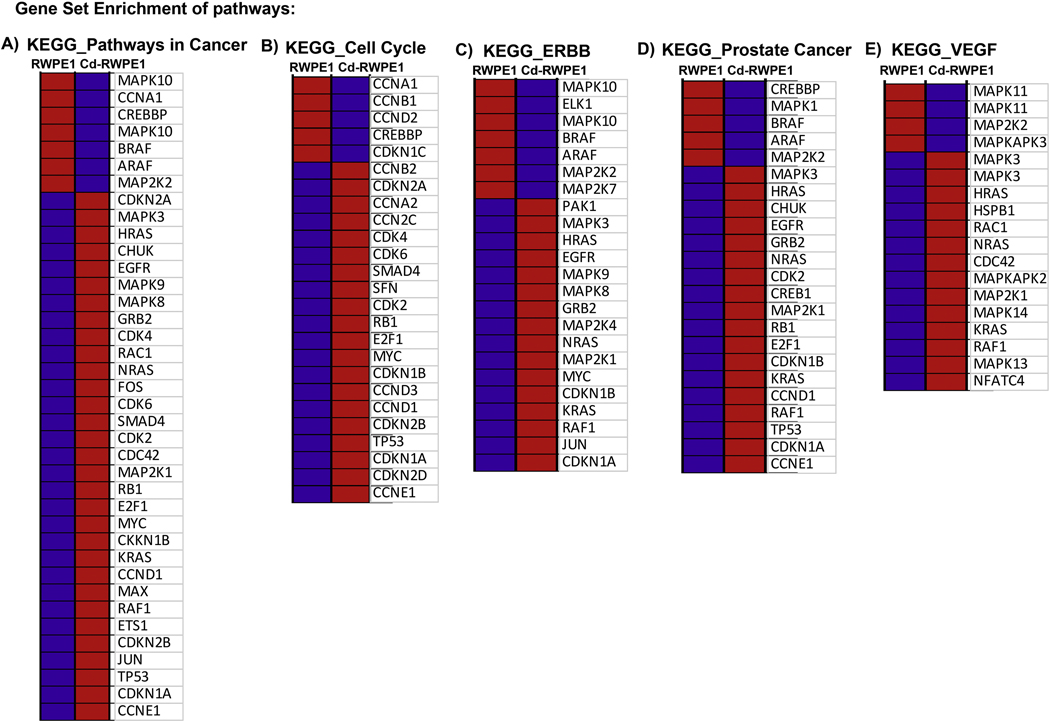
Figure 4:
Gene Set Enrichment Analysis of pathways enriched in Cd-RWPE1 compared to RWPE1 as control. KEGG_Pathways in cancer (A). KEGG_Cell Cycle (B). KEGG_ERBB (C). KEGG_Prostate Cancer (D). KEGG_VEGF (E). Enrichment plots are shown in Supplemental Figure 2. Red-overexpression, Blue-lower expression. The gene lists counterpart to each gradient red and blue bar that is located at the middle of Enrichment plot in Supplemental Figure 2A–E and indicate the genes were assigned in the plot.

