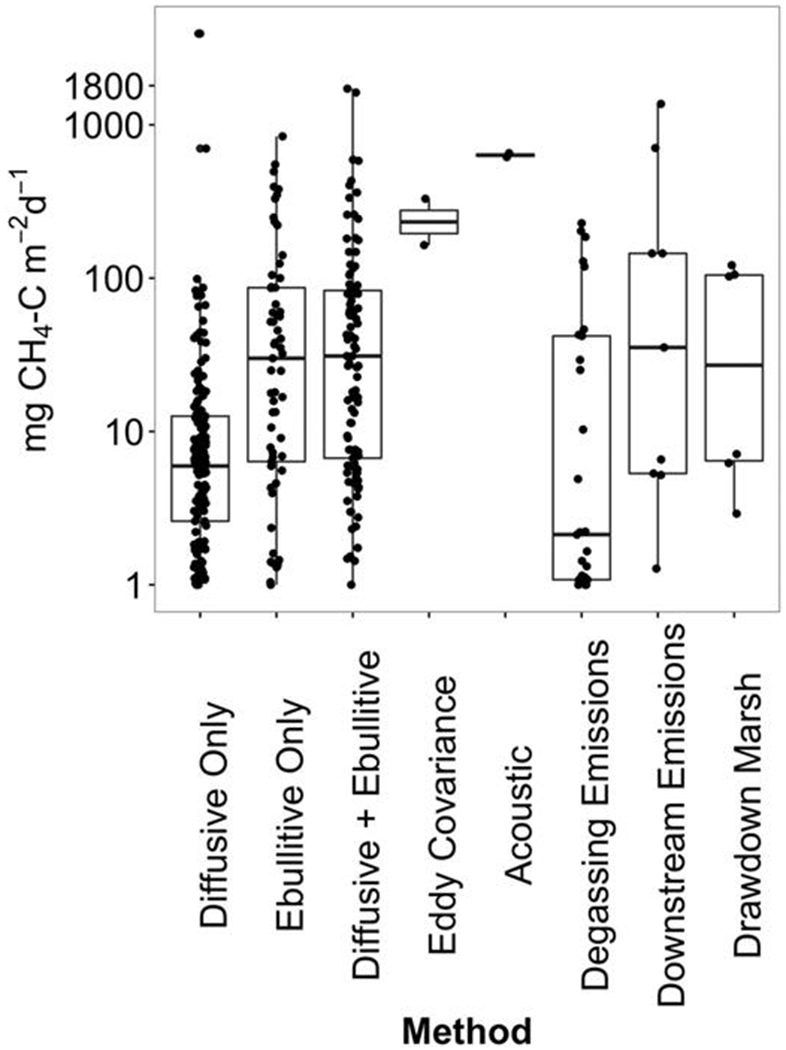
Figure 1.

Areal CH4 fluxes associated with reservoir: diffusive-only fluxes (via thin boundary layer and floating chamber with R2 cutoff values > 0.85, n = 151), ebullitive-only fluxes (via funnels and floating chamber by subtraction, n = 58), diffusive + ebullitive fluxes (via traditional methods n = 89), total CH4 emission via eddy covariance (n = 2), ebullitive emissions via acoustic measurements (n = 2), degassing emissions (n = 22), downstream emissions (n = 6), and drawdown marsh fluxes (n = 6, 5 from Three Gorges Reservoir). Each dot represents the mean flux from a single published paper. The lines within the boxes indicate median fluxes. The boxes demarcate the twenty-fifth and seventy-fifth percentiles; the whiskers demarcate the 95% confidence intervals.
