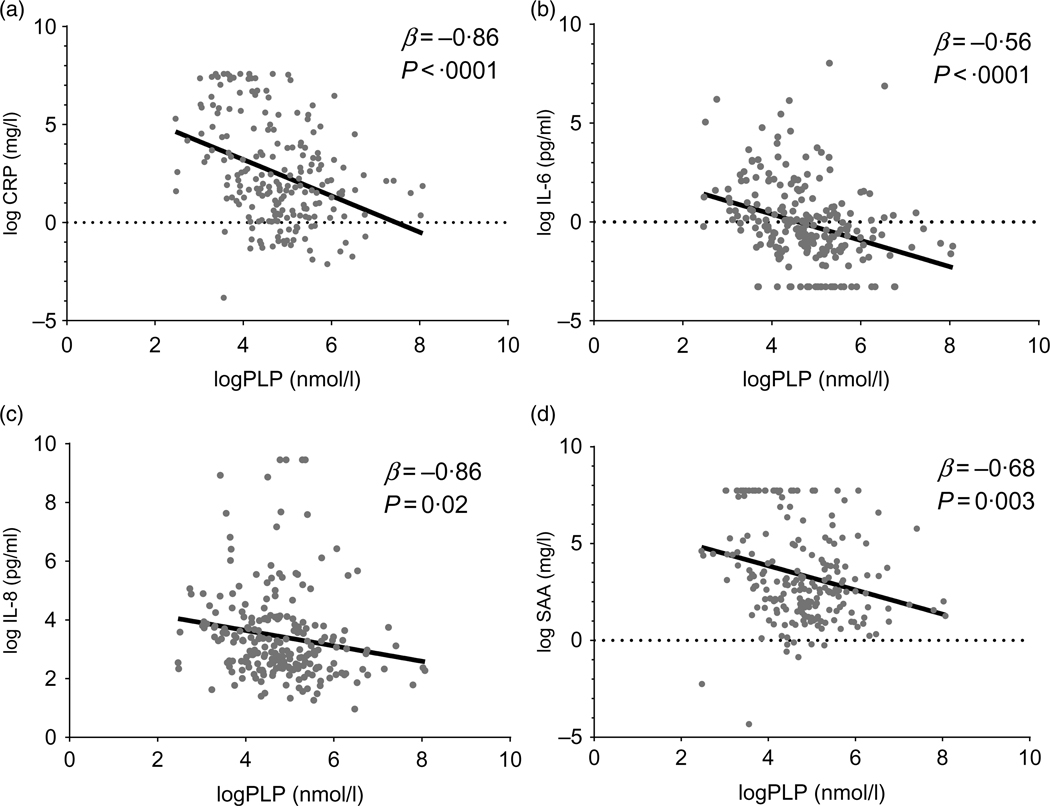
Fig. 1.
Scatter plots of one-carbon metabolite pyridoxal-5’-phosphate (PLP) and inflammation biomarkers C-reactive protein (CRP) (a), IL-6 (b), IL-8 (c) and serum amyloid A (SAA) (d) based on univariate linear regression. The represented biomarkers were log2-transformed to meet the normality assumption for linear regression. Single biomarker values are visualised in grey and the regression line in black. This figure was created with GraphPad Prism8.

