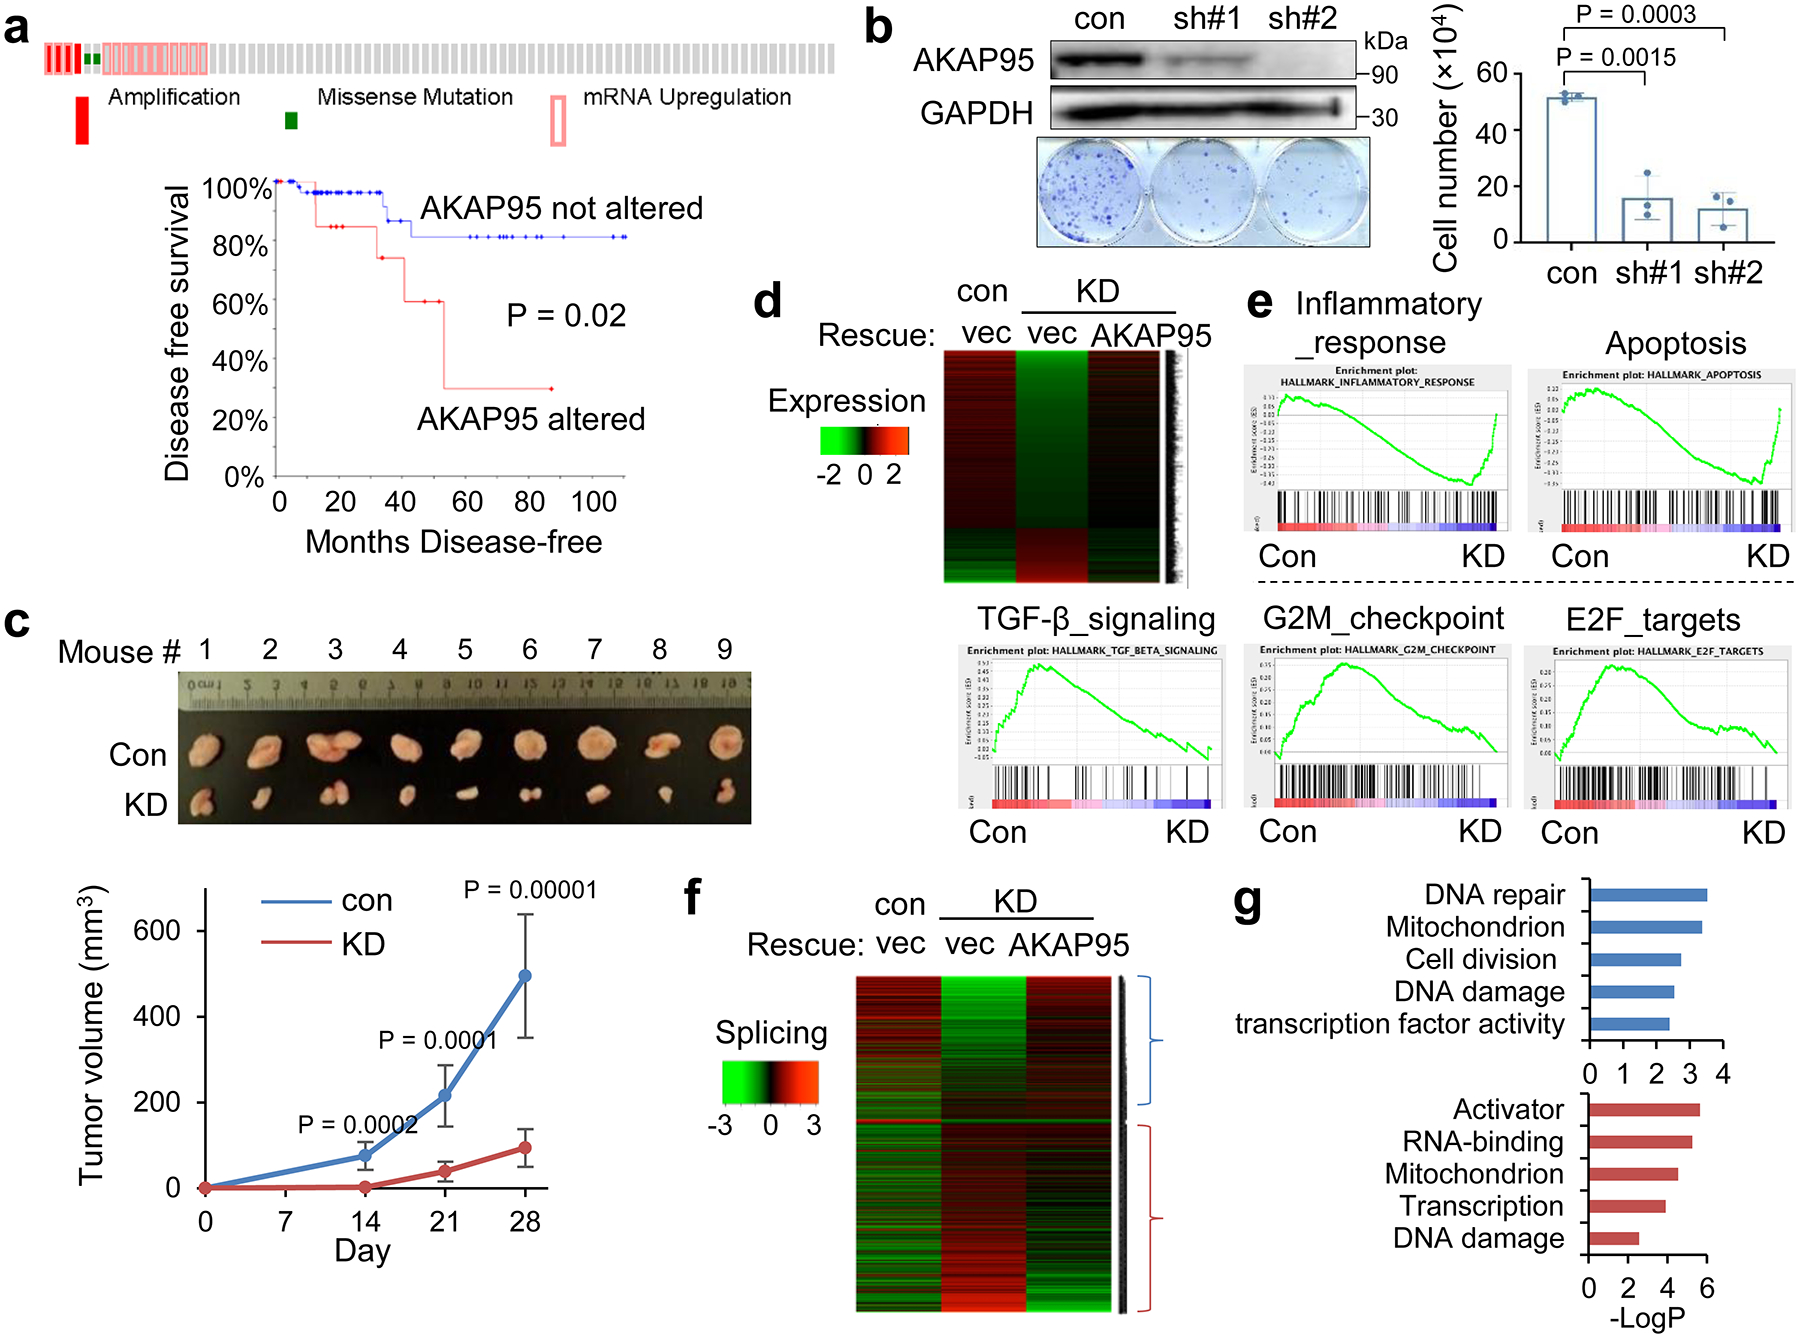
Fig. 1. AKAP95 regulates cancer cell growth and gene expression.

a, Overexpression of AKAP95 in breast cancer tissues of 82 TNBC patient samples. From cBioPortal. Top, each box is a patient sample. Bottom, disease-free survival curves of patients with or without AKAP95 alterations. n = 17 and 65 patient samples for AKAP95 altered and not altered, respectively.
b, Growth assay for MDA-MB-231 cells expressing control or two AKAP95 shRNAs. Left, immunoblotting of total cell lysates and images of cell colonies stained with crystal violet. Right, numbers of cells in growth assays as mean ± SD from n = 3 independent experiments.
c, Tumors from xenograft of control or AKAP95-KD MDA-MB-231 cells in immune-deficient mice. Tumor volumes at the indicated days post transplantation are plotted as mean ± SD (n = 9 mice).
d,e, RNA-seq analysis in MDA-MB-231 cells expressing control or AKAP95 shRNA #1 and the indicated vector or AKAP95-expressing construct. One representative analysis from 2 repeats.
d, Heatmap showing relative expression levels of genes down- or up-regulated in the indicated cells. It includes 951 and 294 genes down- and up-regulated in KD compared to control cells, respectively. Also see Supplementary Table 1a.
e, GSEA for gene expression profiles of control and AKAP95-KD cells. Plots above and below the broken line show gene sets significantly enriched in up- and down-regulated genes by AKAP95 KD, respectively.
f, Heatmap showing relative alternative splicing and clustered by changes in percent-spliced-in (PSI) values in the indicated cells. It includes 807 and 1275 alternative splicing events with decreased or increased PSI in KD cells, respectively. Also see Supplementary Table 1b.
g, Gene ontology analysis for the indicated clusters from the heatmap in f. Blue (n = 807 genes) and red (n = 1275 genes) show functions significantly enriched in genes with PSI increase or decrease by AKAP95 KD, respectively.
P values by log-rank test for a, Student’s t-test for b and d, and modified Fisher’s exact test for g. All two-sided. Uncropped blots and statistical source data are provided in source data fig 1.
