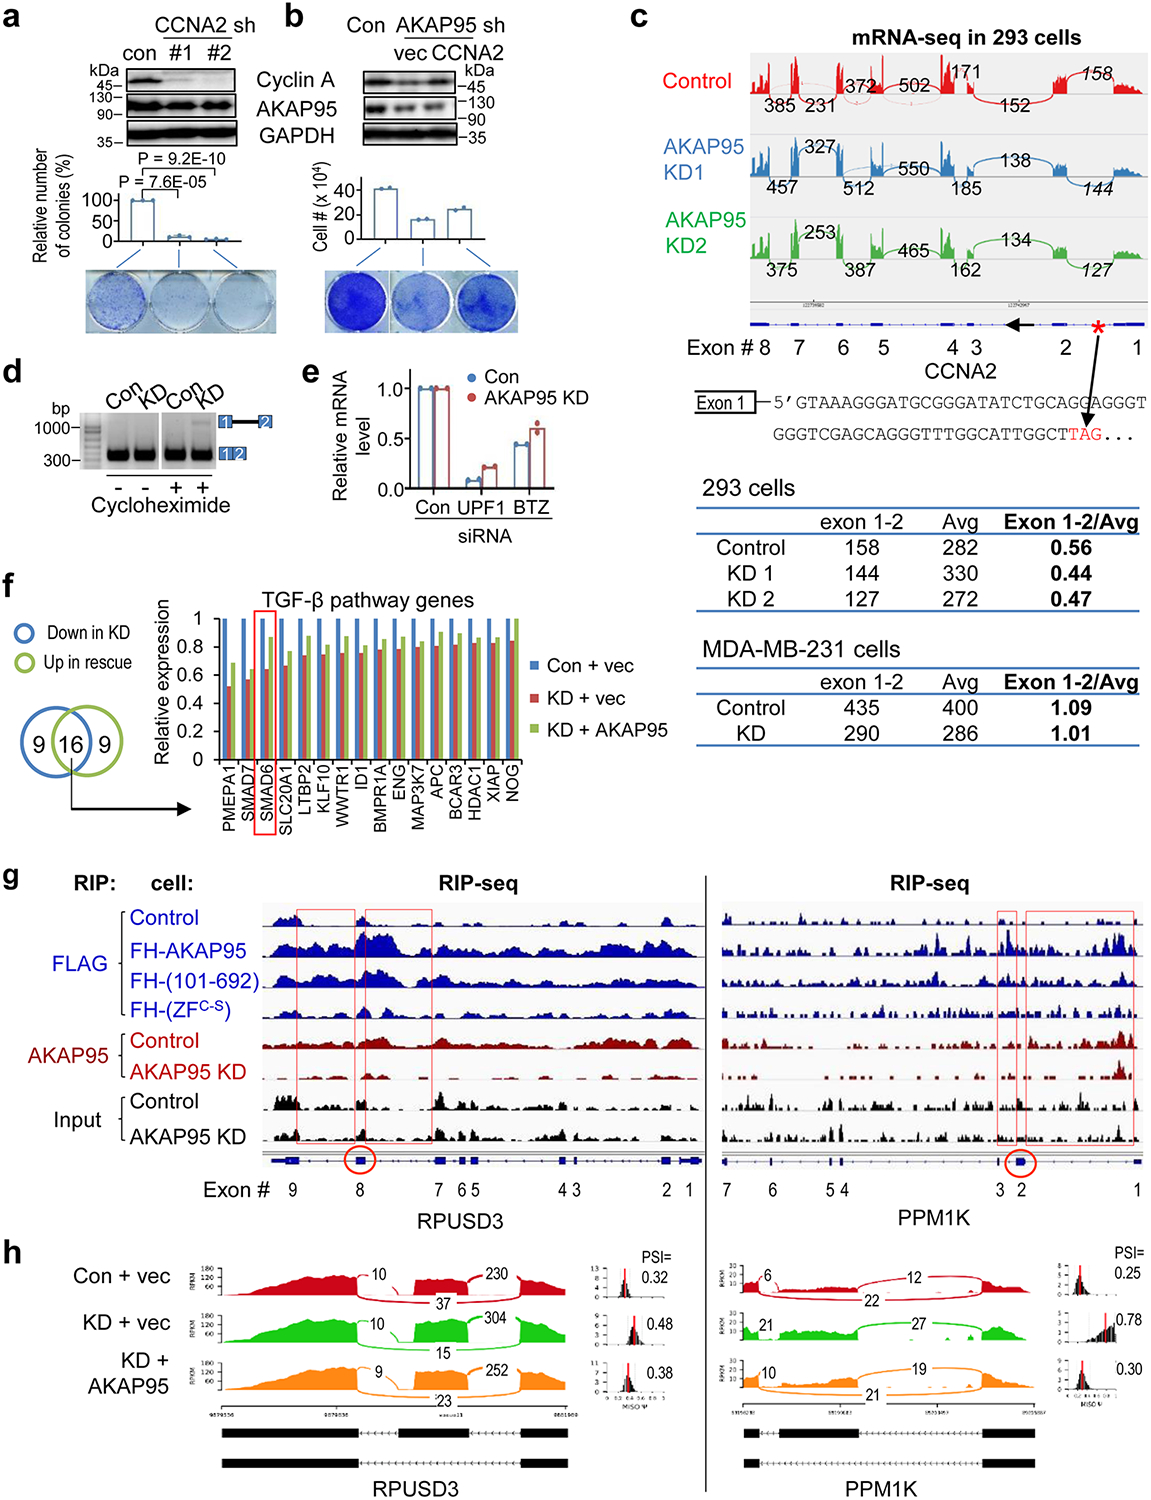
Extended Data Fig. 2. AKAP95 directly regulates splicing of key transcripts for cancer.

a,b, MDA-MB-231 cells virally expressing control or indicated shRNAs (a) or shRNA combined with indicated constructs (b) were subject to immunoblotting of total cell lysates (top) and colony formation assay. Middle, colony numbers as mean ± SD from n = 3 (a) or mean from 2 (b) independent experiments. Bottom, images of cells stained with crystal violet. c, Top, mRNA-seq profiles for CCNA2 in control or AKAP95 KD 293 cells33. The numbers of exon junction reads are indicated. The red asterisk at the gene diagram indicates a stop codon 57 bp downstream of exon 1 in the intron. The number of reads for the junction of exons 1 and 2, and for the average neighboring exons, and their ratios are in the tables below for indicated cells. d, Total RNAs were used for RT-PCR for intron 1 region in control and AKAP95-KD MDA-MB-231 cells treated with or without cycloheximide for 6 hours. Repeated 3 times. e, Relative mRNA levels of UPF in UPF1-KD samples and BTZ in BTZ-KD samples, respectively, each relative to the control samples, as determined by RT-qPCR and normalized to GAPDH. Mean is from 2 independent experiments. f, Relative expression level of TGF-β pathway genes based on RNA-seq reads from control and AKAP95-KD MDA-MB-231 cells expressing vector or AKAP95. Venn diagram shows numbers of TGF-β pathway genes (from GSEA) downregulated by AKAP95 KD and upregulated by rescue with AKAP95 expression, and the relative expression of the 16 overlapped genes in both categories are plotted. One representative analysis from 2 repeats. g, RIP-seq profiles showing AKAP95 binding to RPUSD3 and PPM1K pre-mRNAs. Track information is the same as in Fig. 2c. Red circles indicate the alternatively included exons (corresponding to the middle exon in the gene diagrams in (h), and red boxes show AKAP95 binding at the introns flanking these exons. h, Sashimi plots showing that the alternative splicing of RPUSD3 and PPM1K pre-mRNAs was affected by AKAP95 KD and rescued by restored expression of AKAP95. The numbers of exon junction reads and PSI are indicated. P values by two-sided Student’s t-test for a and b. Uncropped blots and statistical source data are provided as in source data extended data fig 2.
