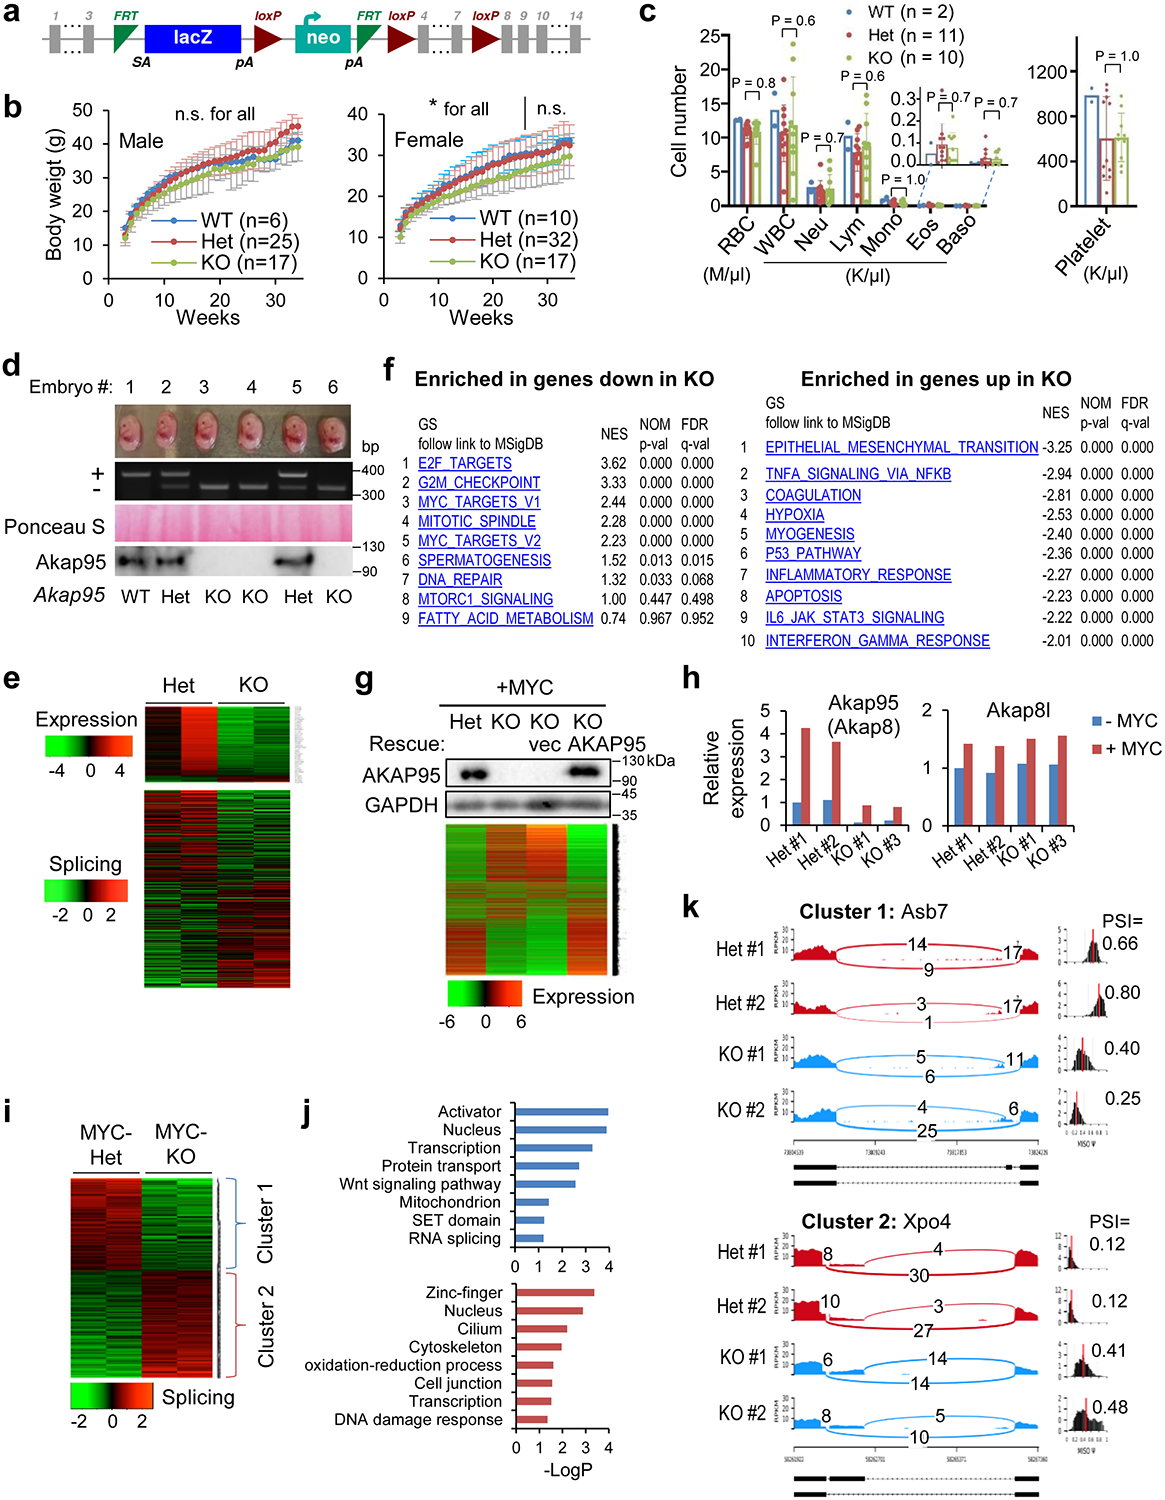
Extended Data Fig. 3. AKAP95 is required for transformation and overcoming oncogene-induced cellular senescence.

a, Schematic of the “Knockout-first” Akap95 allele (null without further recombination). b, Body weights of mice with indicated Akap95 genotypes. Not significant (n.s.) between any two groups at any time for male, or after week 26 for female. *between Het and KO before week 26 for female. c, Peripheral blood profiles of 8-week mice of indicated genotype. n in b, c refers to the number of mice analyzed. d, MEFs were derived from mouse embryos. Images of six embryos from the same litter were shown at the top, followed with genotyping results, Ponceau S staining, and immunoblotting of MEFs. e, Top, heatmap showing relative expression levels of genes and clustered by changes in un-transduced KO MEFs from 2 embryos each. It includes 203 and 20 genes down- or up-regulated in KO, respectively. Bottom, heatmap showing relative alternative splicing of genes clustered by PSI changes. It includes 285 and 332 alternative splicing events with decreased or increased PSI in KO, respectively. Also see Supplementary Table 2f and 7. f, Top 10 gene sets enriched in genes down- (left, n = 265 genes) and up- (right, n = 742 genes) regulated in the MYC-transduced KO versus Het MEFs. g, Rescue of the gene expression profile by introduction of human AKAP95 into the MYC-transduced KO MEFs as shown by immunoblotting and heatmap for relative expression of down- or up-regulated genes in the indicated cells. Also see Supplementary Table 2b. Repeated 2 times. h, Relative expression of Akap95 and Akap8l in un-transduced (-MYC) and MYC-transduced (+MYC) MEFs from n = 2 Het and two KO embryos, as determined by normalized RNA-seq reads. i, Heatmap showing relative alternative splicing of genes clustered by PSI changes in MYC-transduced MEFs from 2 embryos each. It includes 216 and 252 alternative splicing events with decreased or increased PSI in KO versus Het MEFs, respectively. Also see Supplementary Table 2c. j, Gene ontology analysis for the indicated gene clusters from the heatmap in i. Blue (n = 216 genes) and red (n = 252 genes) show functions significantly enriched in genes with PSI increase or decrease by KO, respectively. k, Sashimi plots showing alternative splicing changes for each gene cluster from the heatmap using two examples, Asb7 for cluster 1, and Xpo4 for cluster 2. ns, not significant, *P < 0.05, by two-sided Student’s t-test for b, one-way ANOVA for c and modified Fisher’s exact test for f, j. Uncropped blots and statistical source data are provided as in source data extended data fig 3.
