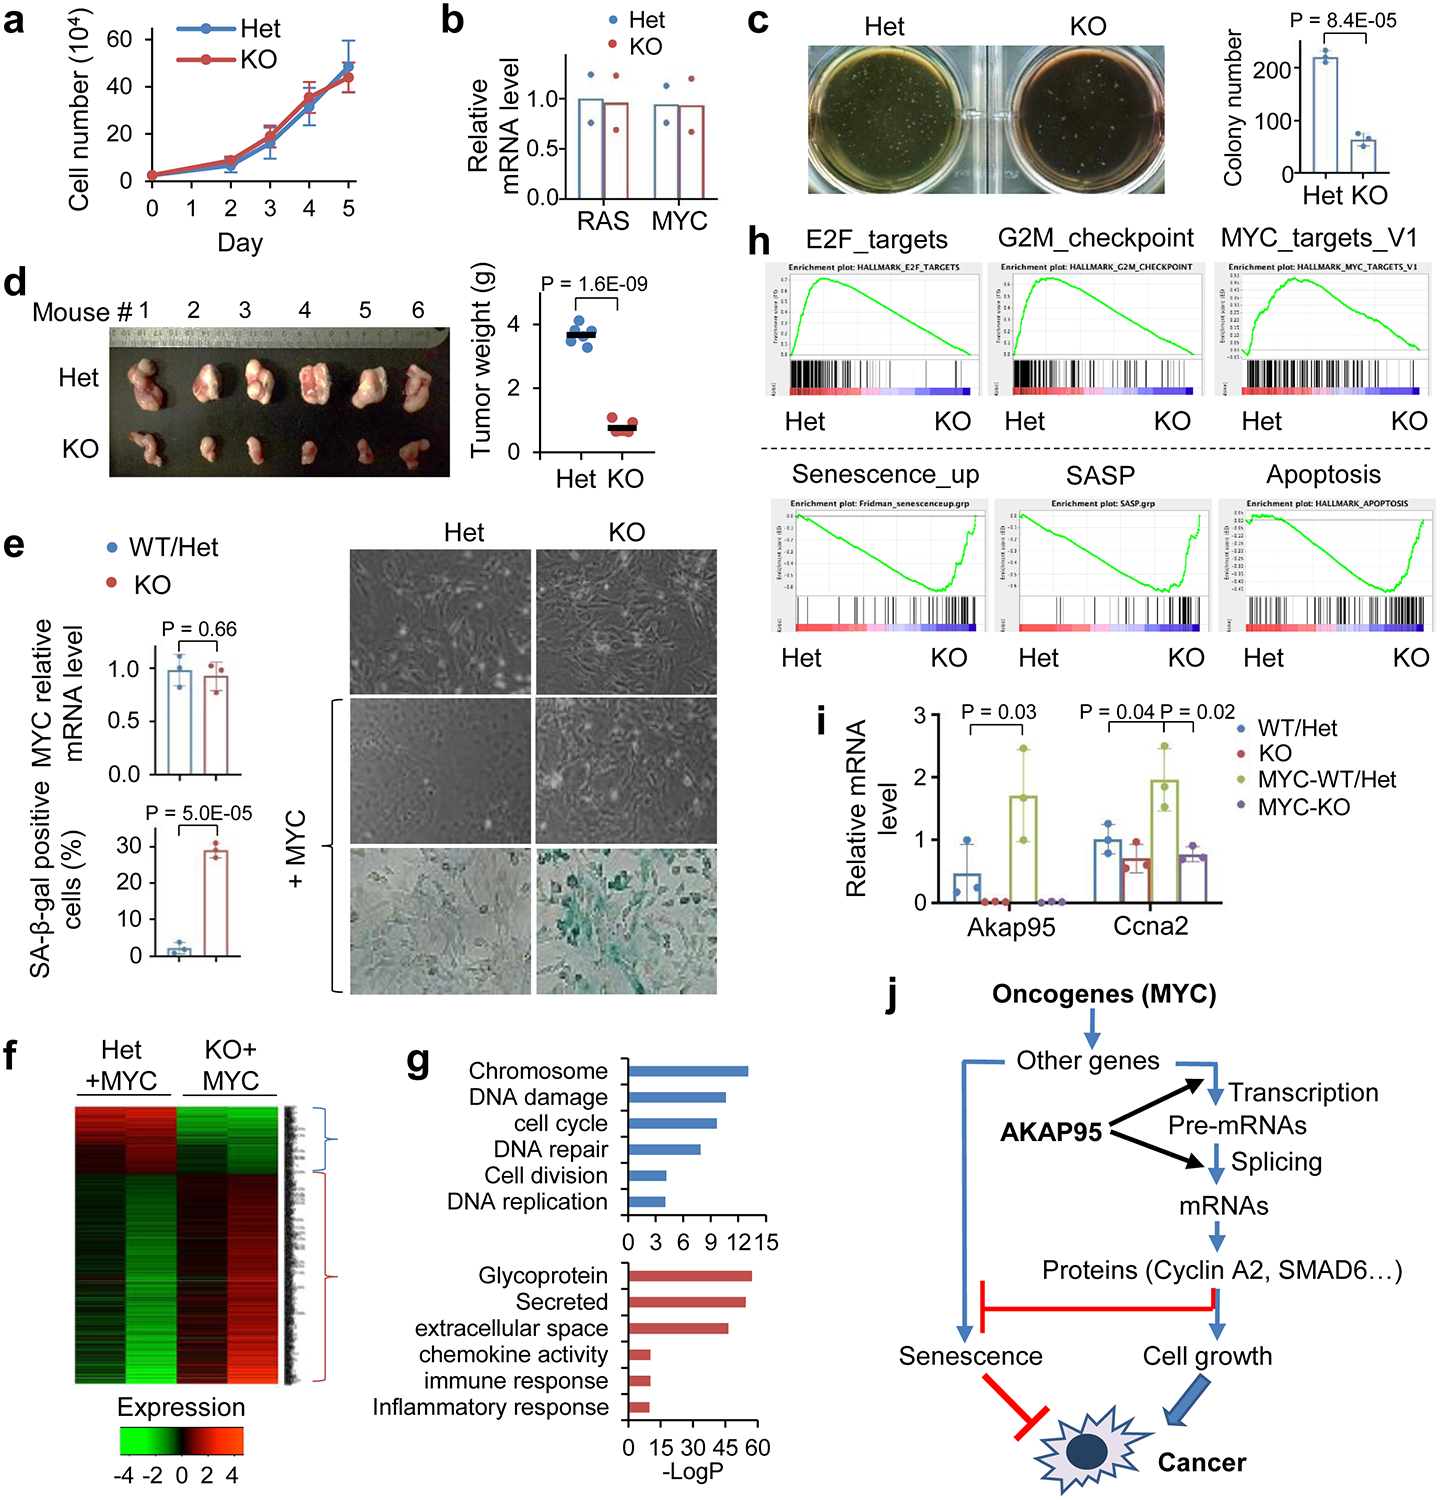
Fig. 3. AKAP95 is dispensable for normal cell growth but required for transformation and suppressing oncogene-induced senescence.

a, Growth of MEFs from Akap95+/- (Het) and Akap95−/− (KO) embryos (n = 6 embryos each).
b, Relative HRAS and MYC mRNA levels by RT-qPCR and normalized to Actb, as mean from HRASG12V and MYC transduced MEFs (2 embryos each).
c, HRAS-MYC-transduced MEFs in colony formation assay. Colony numbers as mean ± SD from n = 6 experiments using MEFs of 2 embryos each.
d, Six mice received HRAS-MYC-transduced Het and KO MEFs on each flank. Tumor weights (week 4) are plotted. Each dot represents a tumor.
e-i, MYC-transduced MEFs from 3 KO and 3 Akap95-expressing (1 WT, 2 Het) embryos.
e, Right, images of cells before and after MYC transduction. Images of SA-beta-galactosidase activity assay are at bottom. Relative MYC mRNA levels after transduction were determined by RT-qPCR and normalized to Actb (left top). Percentage of SA-beta-gal-positive cells are plotted (left bottom). Both as mean ± SD from MEFs (n = 3 embryos each).
f, Heatmap showing relative expression of genes and clustered by changes in KO MEFs (2 embryos each separately analyzed), with 265 and 742 genes down- or up-regulated in KO, respectively. Also see Supplementary Table 2a.
g, Gene ontology analysis for the indicated gene clusters from the heatmap in f. Blue (n = 265 genes) and red (n = 742 genes) show functions significantly enriched in down- and up-regulated genes, respectively.
h, GSEA plots above and below dashed line show gene sets significantly enriched in genes down- and up-regulated in the MYC-transduced KO compared to Het MEFs, respectively.
i, Relative Akap95 and Ccna2 mRNA levels before and after MYC transduction by RT-qPCR and normalized to Actb, as mean ± SD from MEFs from n = 3 embryos each.
j, Diagram summarizing regulation of tumorigenesis by AKAP95 through gene expression control.
P values by two-sided Student’s t-test for all except one-way ANOVA followed by Tukey’s post hoc test for i, and modified Fisher’s exact test for g. Statistical source data are provided as in source data fig 3.
