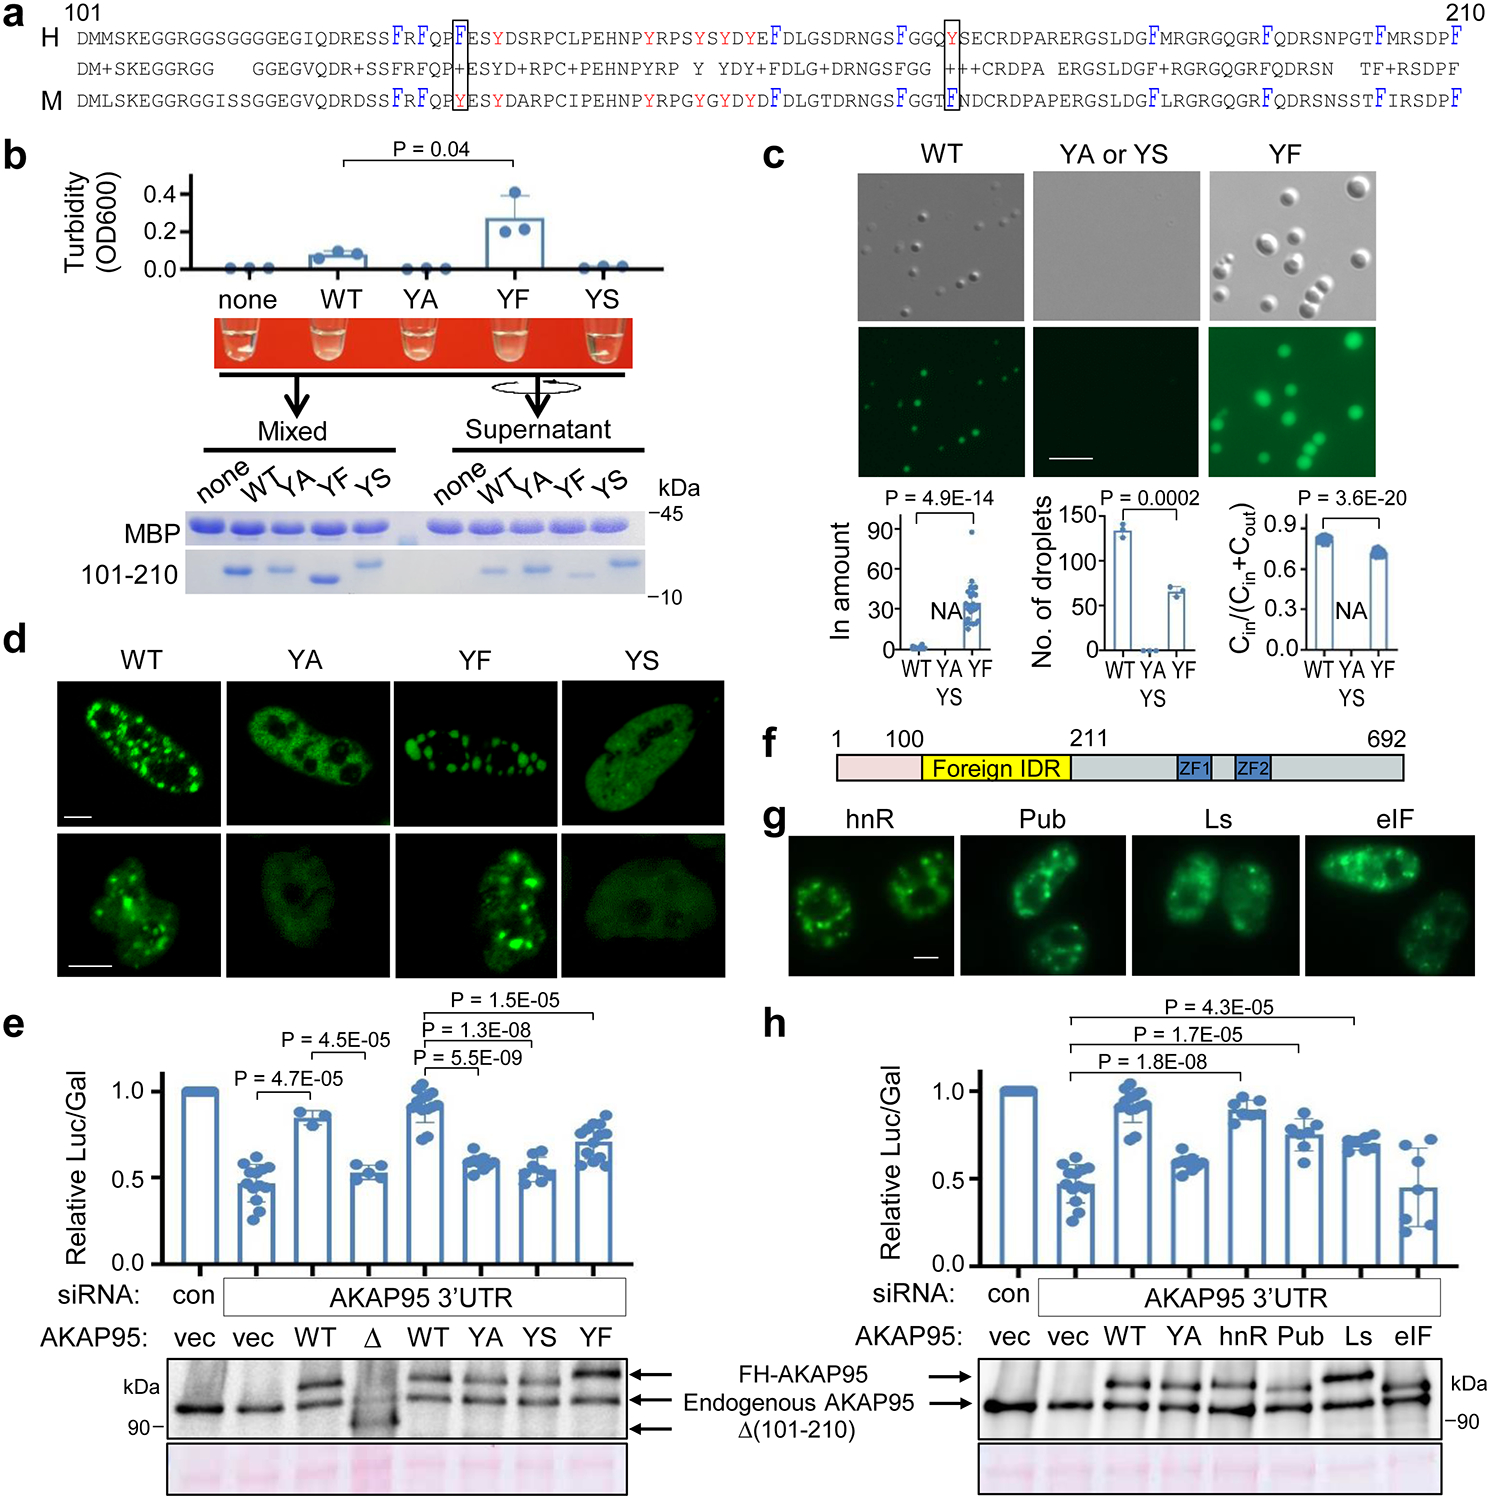
Fig. 6. AKAP95 condensation requires Tyrosine in 101–210 and regulates splicing.

a, Alignment of human and mouse AKAP95 (101–210). Middle row shows identical residues (letter) and conservative mutations (“+”). Tyr, red; Phe, blue and tall. Box, Tyr and Phe swapping.
b, MBP alone (none) or MBP-AKAP95 (101–210) WT or mutants all at 50 μM and in 30 mM NaCl after TEV protease treatment for 30 min. Turbidity of each reaction was shown, and by OD600 as mean ± SD from n = 3 (for YA, YS) or 4 (the rest) independent assays. Samples taken after mixing and from supernatant after centrifugation were resolved by SDS-PAGE followed by coomassie blue staining.
c, DIC and fluorescence microscopy images for 10 μM Oregon-green-labeled MBP-AKAP95 (101–210) WT and mutants in 30 mM NaCl after TEV protease treatment for 30 min. Plots from left to right show relative protein amount in droplet, number of droplets in a field, and ratio of protein concentration inside droplets over sum of inside and outside droplets, respectively, as mean ± SD from n = 24 randomly picked droplets, except for number of droplets from n = 3 randomly picked fields, in one representative assay from 5 repeats. NA, not applicable.
d, Fluorescence microscopy images of HeLa cells (top) and Flp-In T-Rex 293 cell lines expressing (bottom) GFP fusions with full-length AKAP95 WT or mutants. Repeated 4 times.
e,h, HEK293 cells co-transfected with indicated siRNAs and plasmids were subject to splice reporter assay (top) and immunoblotting with α-AKAP95 (bottom). Δ = Δ(101–210). Mean ± SD from n = 8 [except 5 for Δ(101–210) and 13 for YF and 2nd WT] independent transfections are plotted in e and 7 independent transfections in h.
f, Schematic of AKAP95 chimeras.
g, Fluorescence microscopy images of 293T cells transfected with indicated AKAP95 chimeras fused to GFP. Repeated 3 times.
P values by two-sided Student’s t-test for b and one-way ANOVA followed by Tukey’s post hoc test for e and h.
Scale bar, 5 μm for all. Uncropped blots and statistical source data are provided as in source data fig 6.
