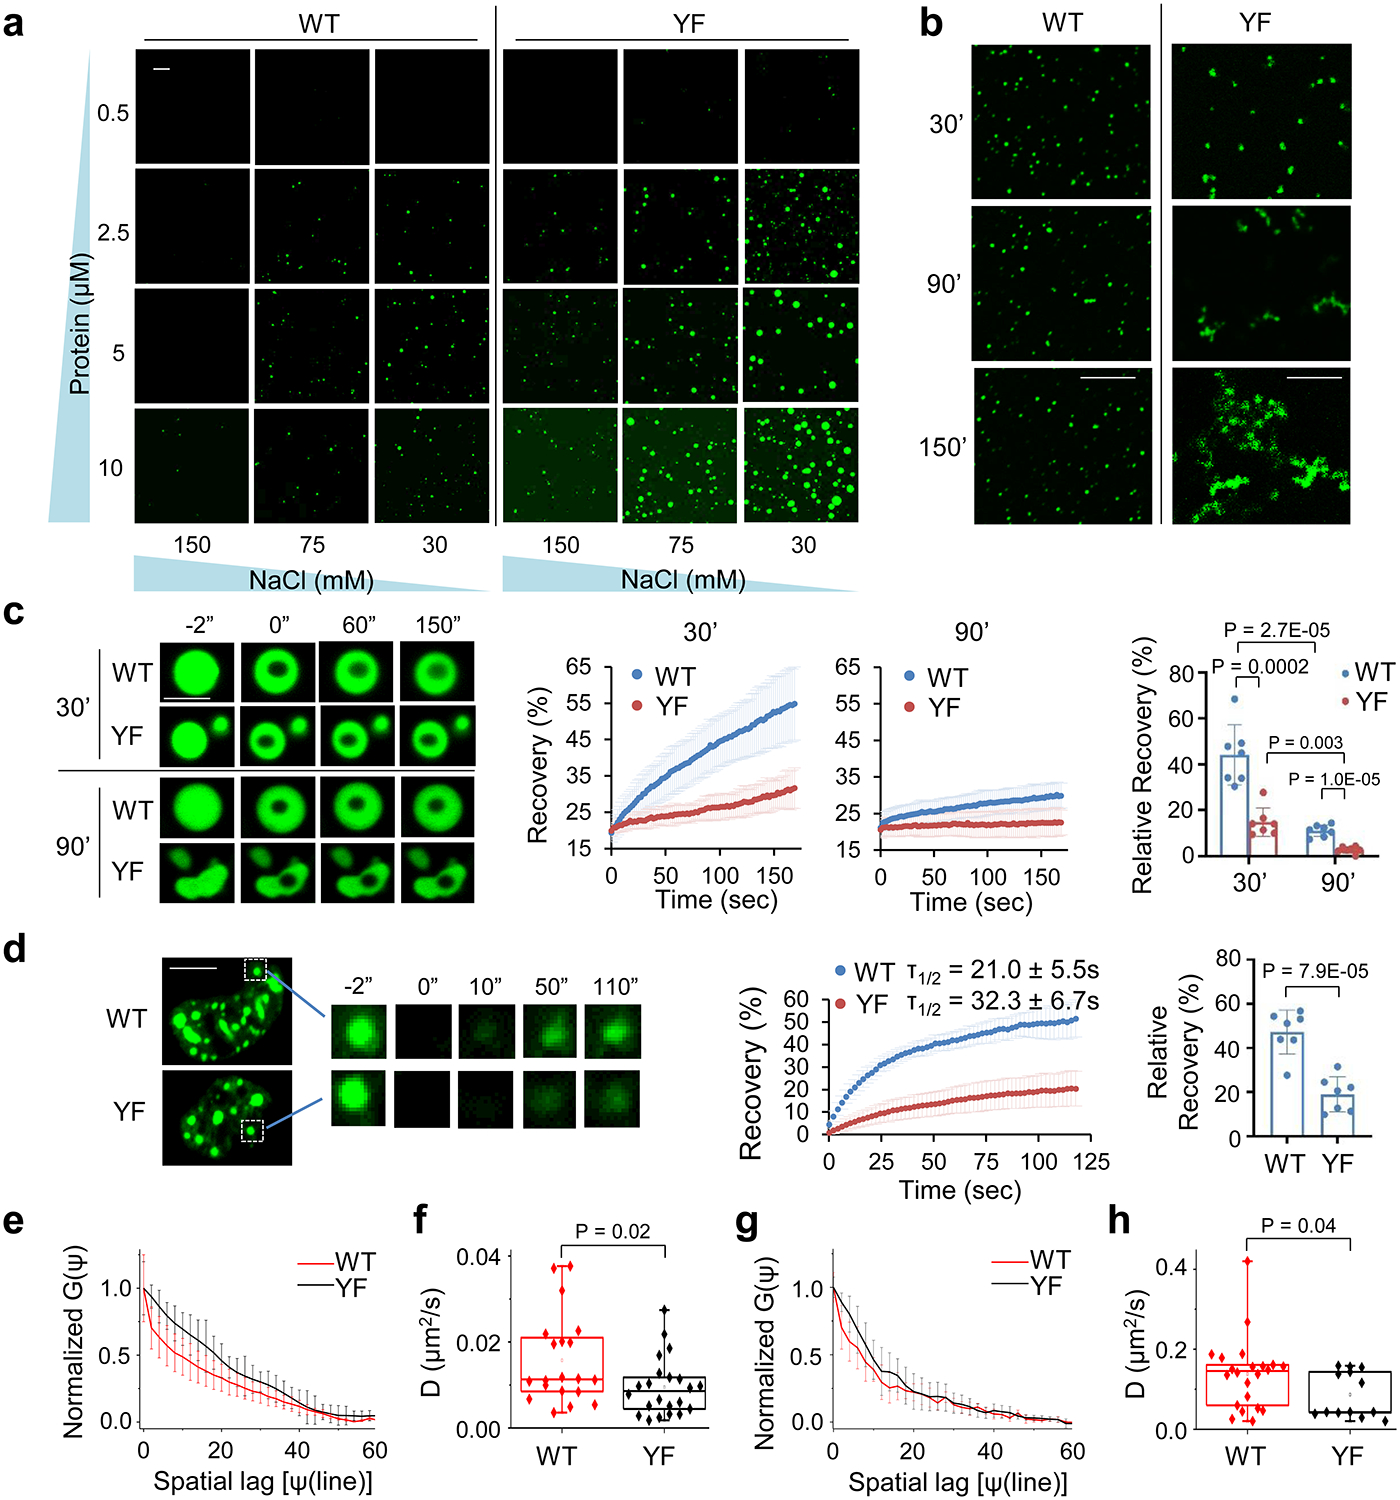
Fig. 7. YF mutation enhances AKAP95 condensation propensity and renders condensates more solid-like state.

a, Fluorescence microscopy images of Oregon-green-labeled AKAP95 (101–210) WT and YF at indicated protein and NaCl concentrations after MBP cleavage for 30 min. Repeated 3 times.
b, Fluorescence microscopy images of 50 μM AKAP95 (101–210) WT and YF in 30 mM NaCl both spiked with Oregon-green-labeled (101–210) WT (molar ratio 150:1) after MBP cleavage for 30’ and imaged immediately (30’) or after incubation for 60 (90’) or 120 (150’) more minutes. Repeated 3 times.
c, FRAP of 10 μM GFP-AKAP95 (101–210) WT and YF after 30 min of MBP cleavage in 150 mM NaCl. FRAP was performed immediately (30’) or after incubation for 60 min more (90’). Left, fluorescence microscopy images of droplets at indicated times. Middle, FRAP recovery curves as mean ± SD. Right, mean ± SD of recovery at the final time. n = 7 independent measurements.
d, FRAP of Full-length AKAP95 WT and YF fused to GFP in HeLa cell nuclei. Left, fluorescence microscopy images of foci. The photobleached focus was boxed and amplified for indicated time points. Middle, FRAP recovery curves as mean ± SD. Right, mean ± SD of recovery (relative to minimal level) at the final time. n = 7 independent measurements.
e,f, Diffusion of full length AKAP95 WT and YF fused to GFP in HeLa cell nuclei, showing Line RICS normalized autocorrelation curves G(Ψ) as function of Spatial Lag (Ψ) (e) and diffusion coefficients (f), as mean ± SD (n = 20 or 22 independent measurements for WT, YF, respectively).
g,h, Diffusion coefficients of purified GFP-AKAP95 (101–210) WT and YF, showing Line RICS normalized autocorrelation curves G(Ψ) (g) and diffusion coefficients (h), as mean ± SD (n = 22 or 13 independent measurements for WT, YF, respectively).
Scale bars, 10 (a, b), 2 (c), 5 (d) μm. P values by two-sided Student’s t-test (c, d) or Mann-Whitney U test (f, h). For box-and-whisker plots, data are median (line), 25–75th percentiles (box) and minimum-maximum values recorded (whiskers). Statistical source data are provided as in source data fig 7.
