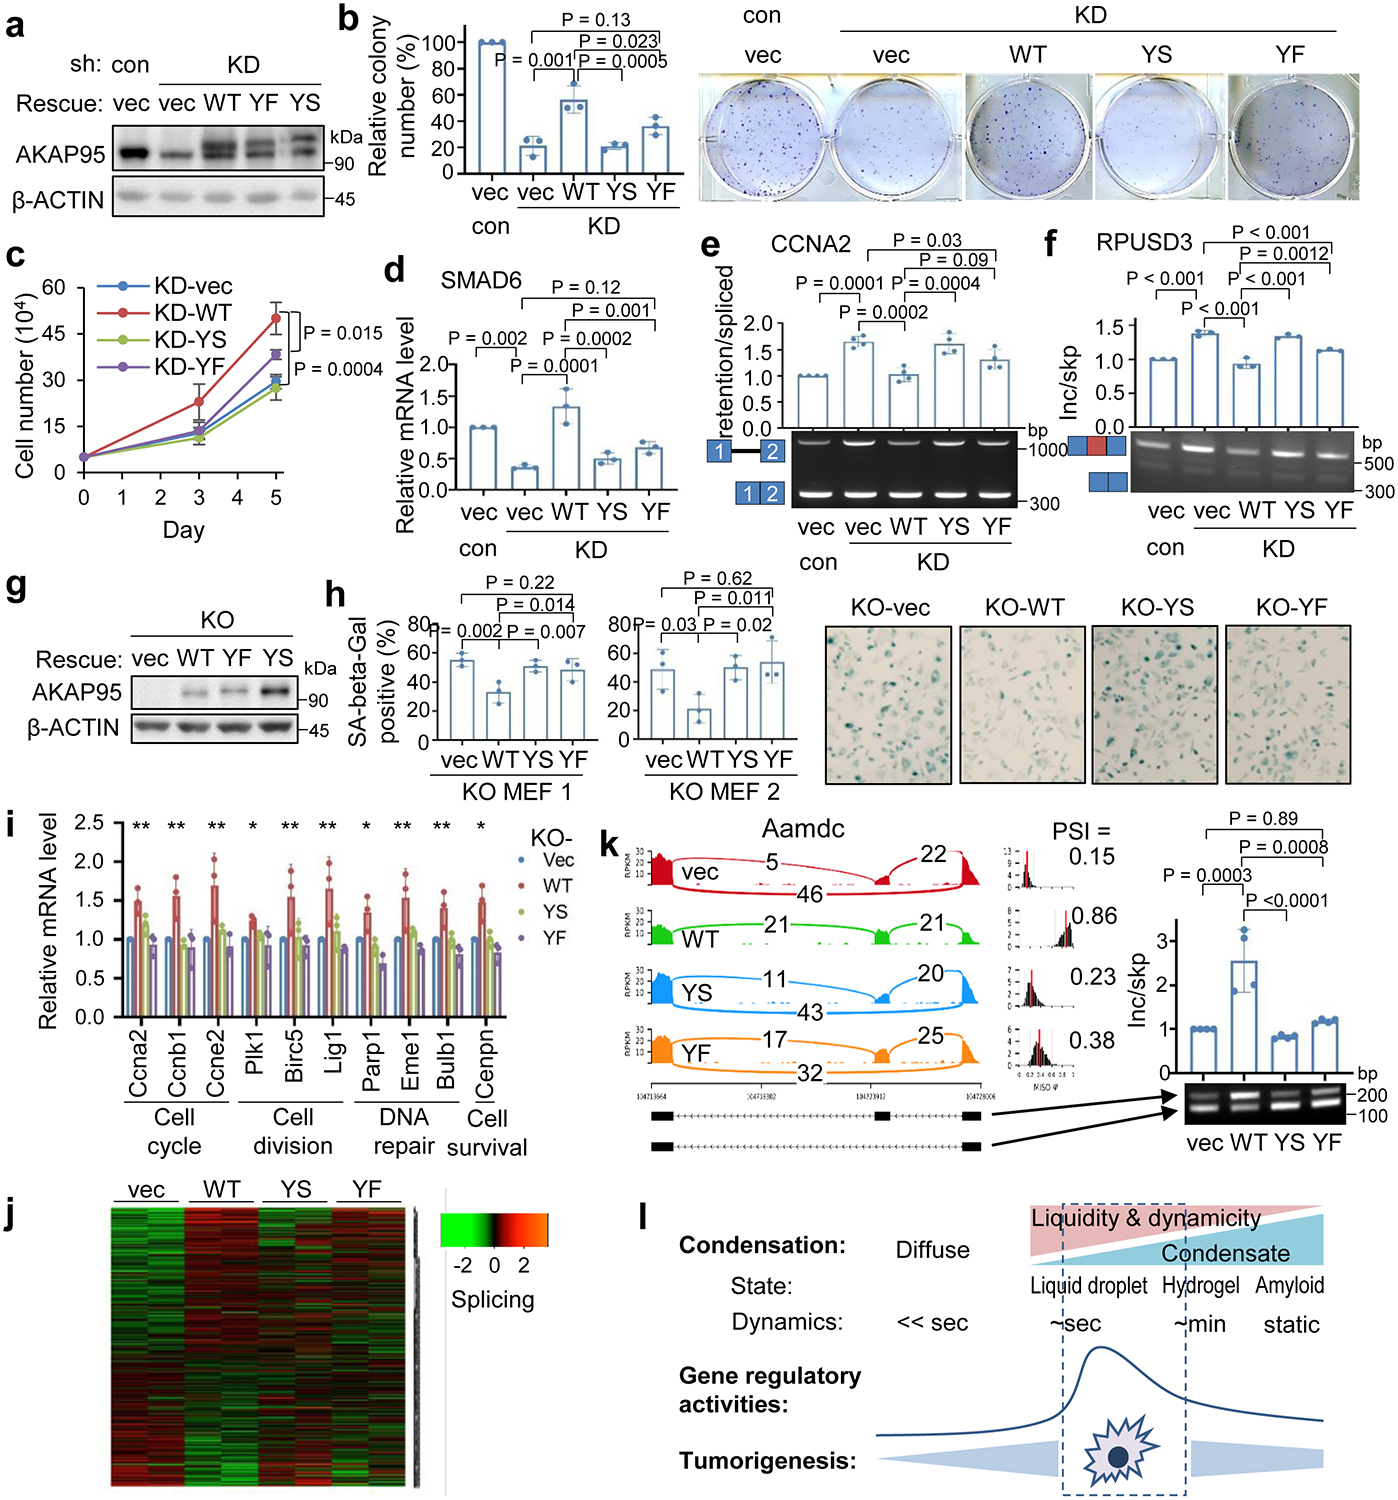
Fig. 8. Regulation of tumorigenesis and gene expression by AKAP95 requires its condensation with proper biophysical properties.

a-f, MDA-MB-231 transduced with control or AKAP95 shRNA #1 (KD) and vector or FLAG-HA-tagged full-length AKAP95 WT or mutants. n = 3 biological repeats for a-f, except n = 4 biological repeats for e.
a, Immunoblotting of total cell lysates.
b, Colony formation assays. Left, colony numbers as mean ± SD. Right, images of cells stained with crystal violet.
c, Growth of cultured cells, as mean ± SD.
d, Relative SMAD6 mRNA level were determined by RT-qPCR and normalized to GAPDH, as mean ± SD.
e,f, RT-PCR for ratios for intron 1-retained over -spliced CCNA2 (e) and exon-included over -skipped RPUSD3 transcripts, as mean ± SD.
g-k, MYC-transduced Akap95 KO MEFs transduced with vector or HA-tagged full-length AKAP95 WT or mutants.
g, Immunoblotting of total cell lysates. Repeated 3 times.
h, Left, percentage of SA-beta-gal-positive cells as mean ± SD (n = 3 different images of MEFs from two embryos). Right, images from KO MEF 1.
i, Relative mRNA levels of indicated genes with related functions at bottom by RT-qPCR and normalized to Gapdh, as mean ± SD (n = 3 independent experiments). * or ** between vec and WT, WT and YS, WT and YF, except for Plk1, for which * only between vec and WT, WT and YF. *P<0.05, **P<0.01.
j, Heatmap showing relative alternative splicing with PSI changes in MYC-transduced KO MEFs expressing indicated constructs (2 embryos each). Also see Supplementary Table 2e.
k, Sashimi plot showing Aamdc alternative splicing that was rescued by introduction of AKAP95 WT, but not but the mutant, and RT-PCR for the inclusion of the alternative exon as mean ± SD (n = 4 biological replicates pooled from 2 embryos each).
l, Diagram showing impact of material properties of AKAP95 WT and mutants on gene regulation and tumorigenesis.
P values by two-sided Student’s t-test for c and one-way ANOVA followed by Tukey’s post hoc test for all other analyses. Uncropped blots and statistical source data are provided as in source data fig 8.
