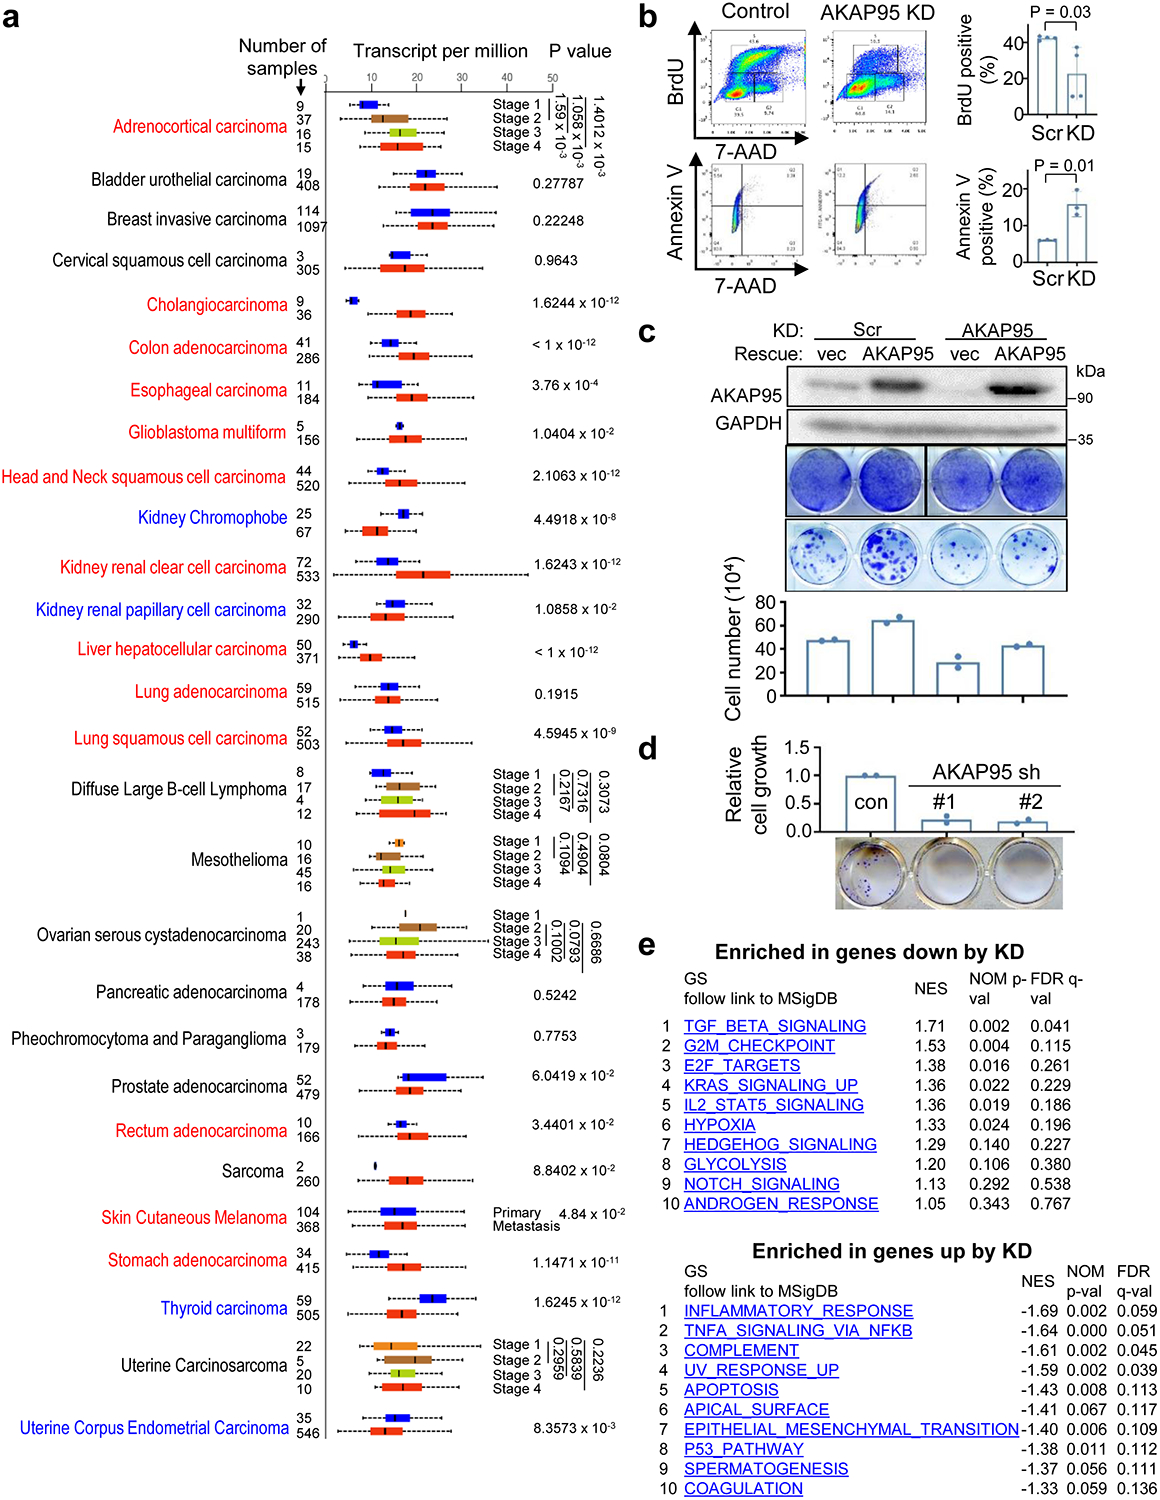
Extended Data Fig. 1. AKAP95 regulates cancer cell growth and gene expression.

a, RNA-Seq–derived gene expression levels from TCGA were analyzed by UALCAN portal. Box plot analysis shows relative expression of AKAP95 in 28 types of cancer (red box) versus normal (blue box) samples, unless indicated for different cancer stages or tumor grades for certain cancer types. Cancer type in red font has significantly higher AKAP95 expression in cancer than in normal (or in later stage than in earlier stage). Cancer type in blue font has significantly lower AKAP95 expression in cancer than in normal samples (or in later stage than in earlier stage). Numbers on the left of the plot stand for the number of samples. Data are median (line), 25–75th percentiles (box) and minimum-maximum values recorded (whiskers). b, Assays for cell proliferation by BrdU incorporation (top) and apoptosis by Annexin V staining (bottom) for control and AKAP95-KD MDA-MB-231 cells. Images of flow cytometry results are shown (left), and percentages of cells positive for BrdU or Annexin V are shown as mean ± SD from n = 3 independent KD assays. c, MDA-MB-231 cells were infected to express scramble (control) or AKAP95 shRNA #1 (KD) and indicated constructs. Top, immunoblotting of total cell lysates. Middle, images of these cells seeded at high (5 ×10⁴ cells/well in 6-well plate, top) and low (400 cells/well in 24-well plate, bottom) densities and stained with crystal violet. Bottom, cell numbers (seeded at high densities) as mean from 2 independent experiments. d, MCF7 cells were infected to express scramble control shRNA or two AKAP95 shRNAs. Bottom, images of indicated cell colonies stained with crystal violet. Top, cell numbers were quantified and presented in the bar graph as mean from 2 independent experiments. e, Top 10 gene sets enriched in genes down- (top, n = 951 genes) and up- (bottom, n = 294 genes) regulated by AKAP95 KD in MDA-MB-231 cells. NES, normalized enrichment score. P values by two-sided Student’s t-test for a-d and modified Fisher’s exact test for e. Uncropped blots and statistical source data are provided as in source data extended data fig 1.
