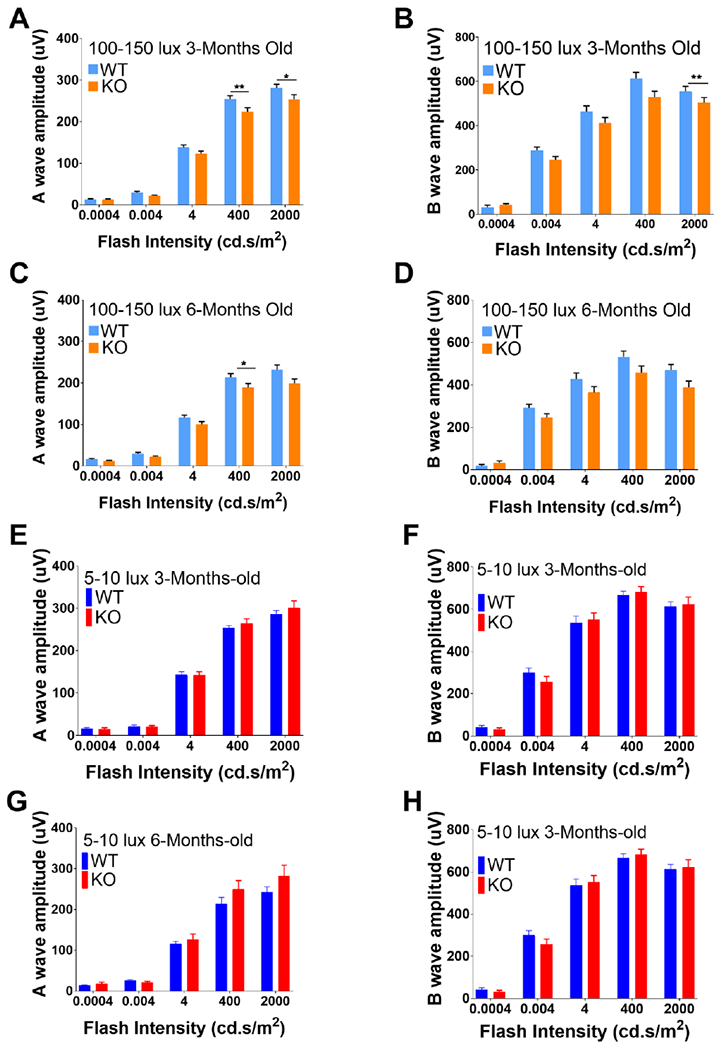
Figure 7.

Scotopic ERG and ONL quantification for WT and Sphk1 KO mice. ERG responses for scotopic function were recorded for five flash stimuli at intensities of 0.0004, 0.004, 4, 400 and 2000 cd.sec/m2. A-D) Animals raised in 100-150 lux light conditions. A) A-wave responses in 3-month-old WT and KO mice raised (WT n=11, KO n=13; *p=0.03; **p=0.008). B) B-wave responses in 3-month-old mice (WT n=11, KO n=13 B; *p=0.007). C) A-wave responses in 6-month-old animals (WT n=9, KO n=10, *p=0.03). D) B-wave responses in 6-month-old animals (A-D: WT n=9, KO n=10.) E-H) Animals raised in 5-10 lux light conditions. E) A-wave responses for 3-month-old mice raised in dim light. F) B-wave responses for 3-month-old mice raised in dim light. G) A-wave responses for 6-month-old mice raised in dim light. H) B-wave responses for 6-month-old mice raised in dim light (E-H n=5). Two-way ANOVA with Bonferroni’s correction for multiple comparisons, α=0.05. All error bars are SEM.
