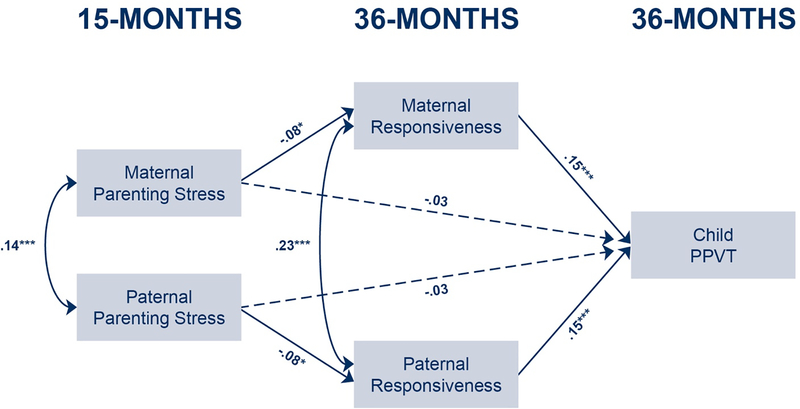
Figure 1.
Associations between parenting stress, responsiveness, and child PPVT. Mothers’ and fathers’ pathways are constrained.
Dotted lines indicate pathways where p > .05.
Note: Coefficients are standardized. Mothers’ and fathers’ pathways are constrained to be equal. Model controls for parental depression, race, education, age, number of biological children, child sex, treatment group, income-to-poverty ratio, marital status, and residential status.
N = 812 *p < .05, **p < .01, ***p < .001
CFI: 1.00, RMSEA: 0.02; SRMR: 0.00. Indirect effect, mothers and fathers: b = −0.34, SE = 0.14, p = .017, bootstrapped 95% CI: [−0.62, −0.06]

