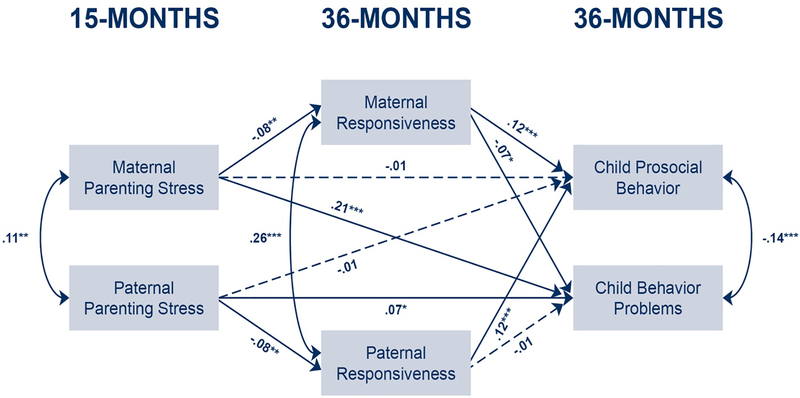
Figure 2.
Associations between parenting stress, responsiveness, child prosocial behavior and child behavior problems. Mothers’ and fathers’ pathways are constrained, except for pathways from predicting child behavior problems. Dotted lines indicate pathways where p > .05.
Note: Coefficients are standardized. Model controls for parental depression, race, education, age, number of biological children, child sex, treatment group, income-to-poverty ratio, marital, and residential status.
N = 1,173 *p < .05, **p < .01, ***p < .001
CFI: 1.00, RMSEA: 0.00; SRMR: 0.00. Indirect effect, prosocial behavior, mothers and fathers: b = −0.01, SE = 0.00, p = .007, bootstrapped 95% CI [−0.014, −0.002]. Indirect effect, child behavior problems: mothers: b = 0.003, SE = 0.00, p = .065, bootstrapped 95% CI [0.00, 0.006] fathers: b = 0.00, SE = 0.00, p = .827, 95% CI [−0.002, 0.002].

