
Fig 5. Linear correlation of hemispheric CTASI-rHU and CTP-based total ischemic volume.
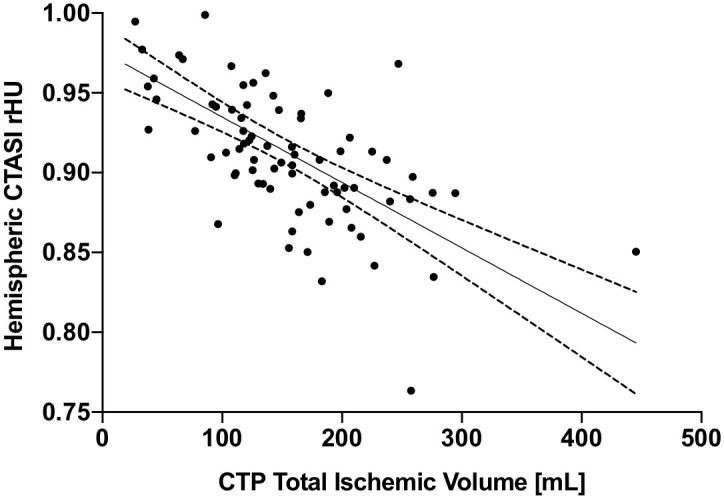
Graph presents scatter plot, trend line and 95% confidence interval. Abbreviations: CTASI, CT angiography source images; rHU, relative Hounsfield Units; CTP, CT perfusion.