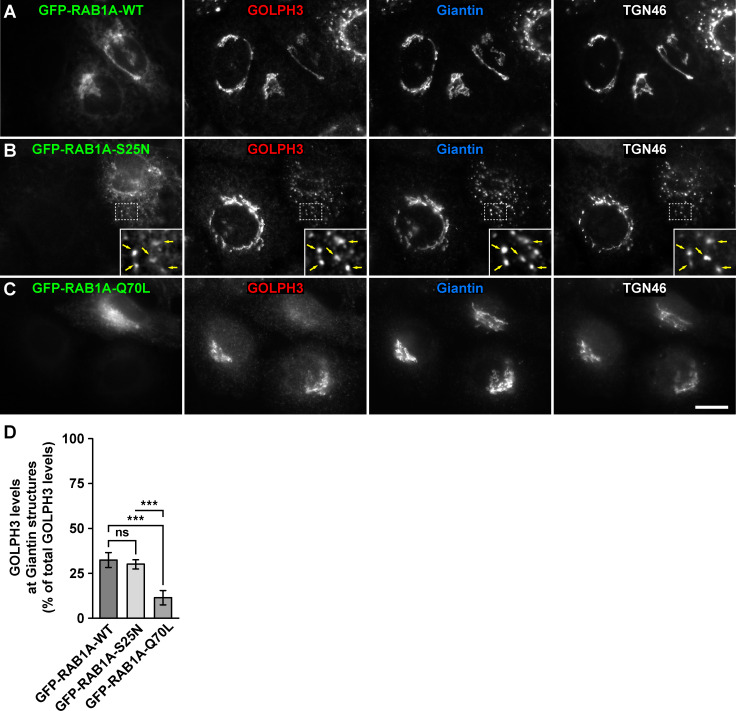
Fig 6. Fluorescence microscopy analysis of the effect of the expression of GFP-tagged RAB1A variants on GOLPH3 subcellular distribution.
(A-C) H4 cells grown in glass coverslips were transfected to express either of the indicated GFP-tagged variant of RAB1A (green channels). Cells were fixed, permeabilized, and triple-labeled with rabbit polyclonal antibody to GOLPH3, mouse monoclonal antibody to Giantin and sheep polyclonal antibody to TGN46. Secondary antibodies were Alexa-Fluor-594-conjugated donkey anti-rabbit IgG (red channels), Alexa-Fluor-647-conjugated donkey anti-mouse IgG (blue channels) and Alexa-Fluor-350-conjugated donkey anti-sheep IgG (white channels). Stained cells were examined by fluorescence microscopy. Insets in B: X3 magnification, with arrows indicating colocalization at Golgi punctae. Bar, 10 μm. (D) Quantification as described in Materials and Methods of the percentage of fluorescence signal of anti-GOLPH3 associated to Golgi elements decorated with anti-Giantin. Bar represents the mean ± standard deviation (n = 3 independent experiments, and 15 cells in each experiment were analyzed). *** P < 0.001; ns, not statistically significant.

