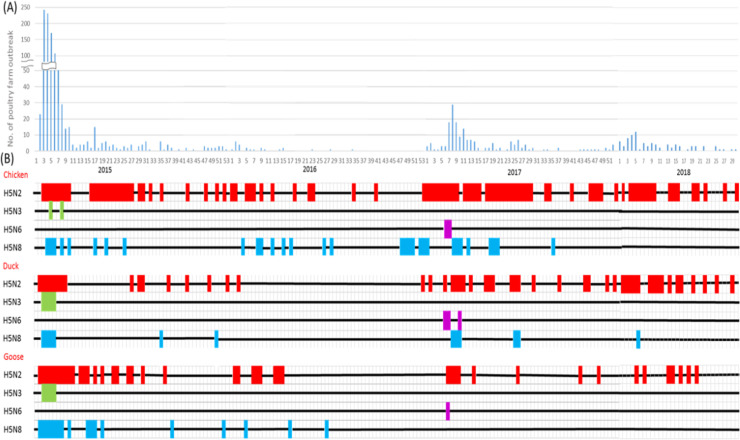
Fig 3. Temporal distribution of Highly Pathogenic Avian Influenza (HPAI) H5Nx in poultry farms by subtypes in Taiwan from Jan., 2015 to Jul., 2018.
(A) Epidemic curve of HPAI outbreak farms by week during 2015–2018. (B) Timeline of the appearance of HPAI by poultry type and H5Nx virus subtype. The color code for each subtype is H5N2 (red), H5N3 (green), H5N6 (purple), and H5N8 (cyane). The timeline plotted by week corresponded to the time axis plotted in (A).

