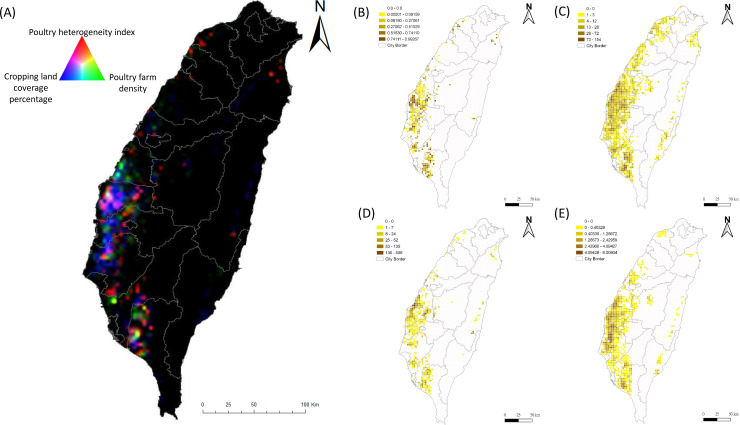
Fig 5. Spatial distribution of predictor variables responsible for the persistence of H5N2 and H5N8 HPAI H5-subtypes among poultry farms in Taiwan.
(A) RGB composite plot of the distribution of three predictor variables: poultry heterogeneity index (domestic anseriformes to galliformes density (red), poultry farm density (green), and cropping land coverage percentage (blue). Dark areas correspond to low values and light areas to high values in all 3 predictors. Black indicated no poultry farm. Density map of poultry heterogeneity index (B), all registered poultry farms (C), non-registered waterfowl flocks (D), and non-rice cropping area coverage (E) in Taiwan. Density is expressed as numbers of flocks per 3x3km grid.

