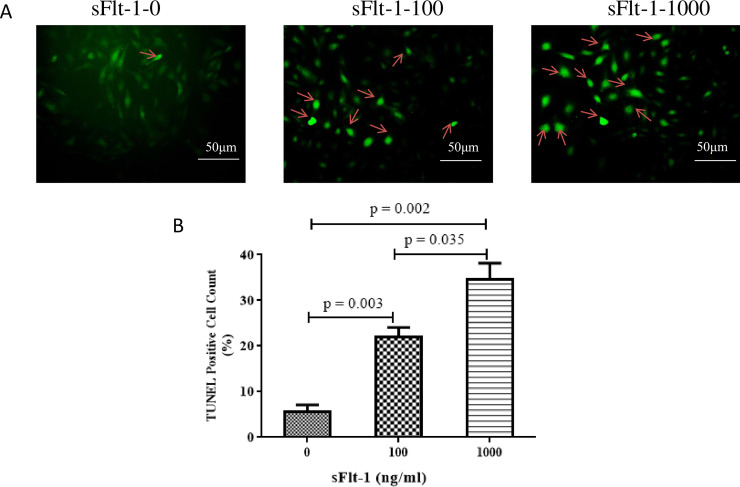
Fig 5. The apoptosis rate of HUVECs was measured using TUNEL assay.
The figure showed a representative set of the graph of apoptosis rate of HUVECs by TUNEL staining. A: the indicated concentrations of sFlt-1-treated group, and B: statistical result of apoptosis rate of HUVECs in different groups. TUNEL analysis showed that sFlt-1 could induce an abundance of apoptosis in a dose-dependent manner (100 ng/ml vs. 0 ng/ml: 22.0 ± 3.60% vs. 5.67 ± 2.52%, p = 0.003; 1000 ng/ml vs. 0 ng/ml: 34.67 ± 6.03% vs. 5.67 ± 2.52%, p = 0.002; 1000 ng/ml vs. 100 ng/ml: 34.67 ± 6.03% vs. 22.0 ± 3.60%, p = 0.035). Results are the means ± standard deviation of three independent experiments. Scale bar denotes 50μm. Arrows indicate TUNEL-positive cells.

