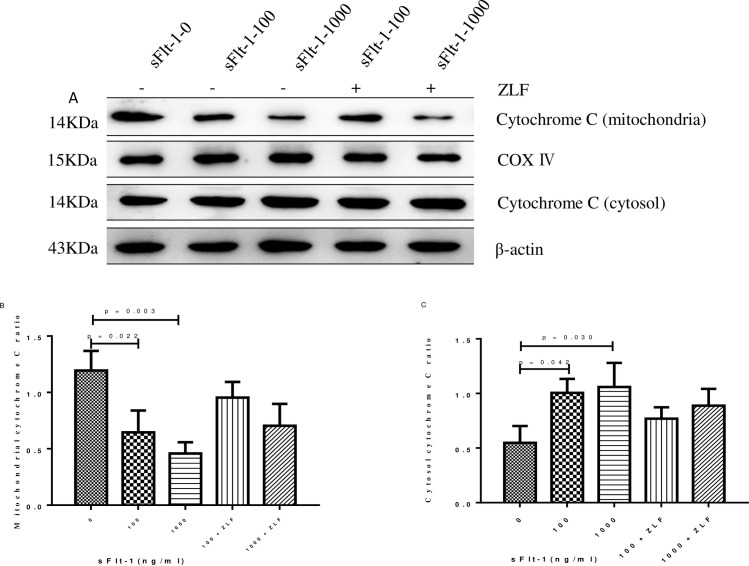
Fig 8. Cytochrome c expression in the mitochondria and cytosol in sFlt-1-induced HUVECs with or without Z-LEHD-FMK incubation.
The HUVECs were treated with the indicated concentrations of sFlt-1, and then treated with or without Z-LEHD-FMK. The protein expression levels of cytochrome c expression in the mitochondria and cytosol were detected by western blotting (A). Relative protein levels in mitochondria (B) and cytosol (C) were presented as histograms. Results are the means ± standard deviation of three independent experiments.

