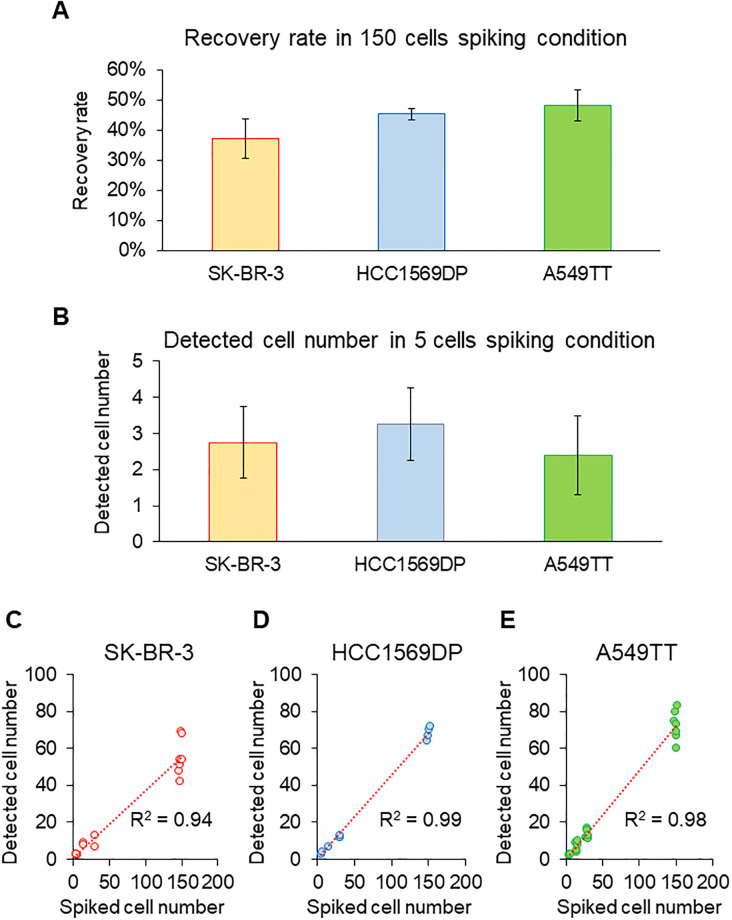
Fig 3. Recovery rate, lower limit of detection, and linearity.
(A) Recovery rates of SK-BR-3 (n = 7), HCC1569DP (n = 4), and A549TT (n = 7). Recovery rate was calculated for 150 cells spiked into whole blood. Data are presented as mean ± 1 standard deviation (SD). (B) Lower limits of detection of SK-BR-3 (n = 4), HCC1569DP (n = 4), and A549TT (n = 5). Lower limits of detection were calculated as the minimum spiking condition where the value obtained by subtracting 2 SD from the average number of detected cells is ≥1. Data are presented as mean ± 2 SD. (C–E) Linearity of SK-BR-3 (n = 21), HCC1569DP (n = 19), and A549TT (n = 26). Linearity was evaluated by the coefficient of determination in the first-order linear regression equation of a scatter diagram that plots numbers of detected cells against numbers of spiked cells. https://doi.org/10.6084/m9.figshare.12433265.v3.

