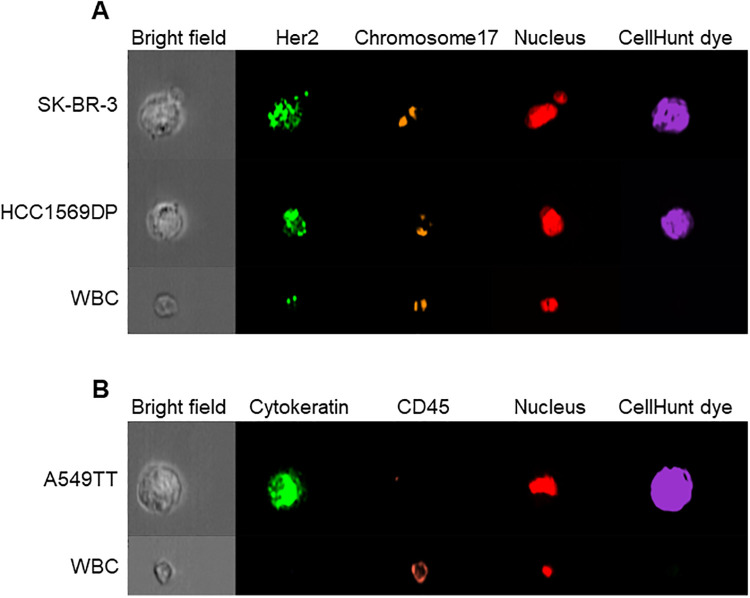
Fig 4. Cell images of each cell line and white blood cells obtained by imaging flow cytometry.
(A) FISH staining image of SK-BR-3, HCC1569, and white blood cells. HER2 (green) and chromosome 17 (red) were stained using the Cytocell HER2 FISH probe, and the nucleus was stained using DRAQ5. (B) Immunostaining image of A549TT and white blood cells. Cytokeratin (green) and CD45 (red) were stained by specific antibodies. The nucleus was stained with Hoechst 33342. https://doi.org/10.6084/m9.figshare.12433484.v1.

