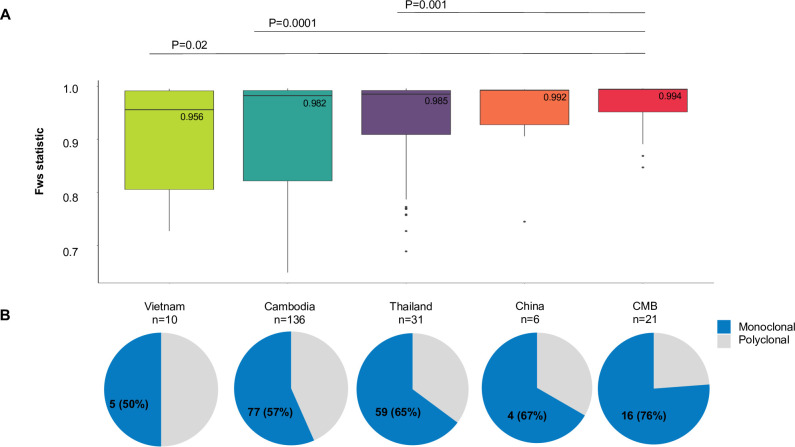
Fig 2. Clonality within sample sites from the Greater Mekong Subregion.
A) Inbreeding within the GMS countries, as denoted by the Fws statistic. Medians are labelled and P values from pairwise Wilcoxon rank-sum test are shown. B) Pie charts representing the proportion of monoclonal (blue, Fws ≥ 0.95) or polyclonal (gray, Fws < 0.95) samples for each location ordered as in A.

