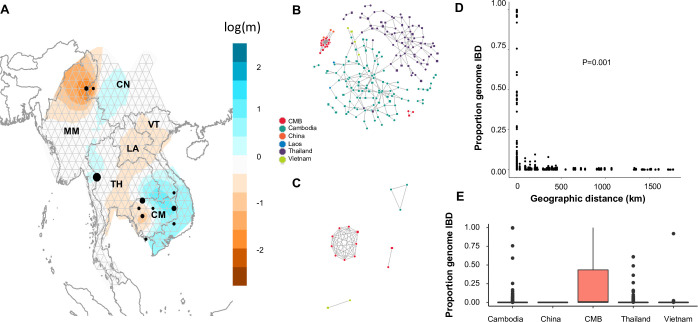
Fig 5. Relatedness and transmission of P. vivax within the Greater Mekong Subregion.
A) Effective migration surfaces wherein each black dot represents one population. Areas which are more orange represent reduced effective migration whereas blue areas represent more effective migration. B) IBD network showing connection between samples sharing at least 1% of their chromosomal genome in IBD segments of 25 kb or longer. Squares represent polyclonal samples, while circles represent monoclonal samples. C) IBD network showing connection between samples sharing at least 90% of their chromosomal genome in IBD segments of 25 kb or longer. Squares represent polyclonal samples while circles represent monoclonal samples. D) Comparison of pairwise shared IBD and distance in km. P value is from Mantel testing distance vs IBD. E) Pairwise IBD sharing in sample sites within each location. For Thailand and Cambodia, which have multiple sample sites, only samples collected from the same sample sites (distance in km = 0) were included.

