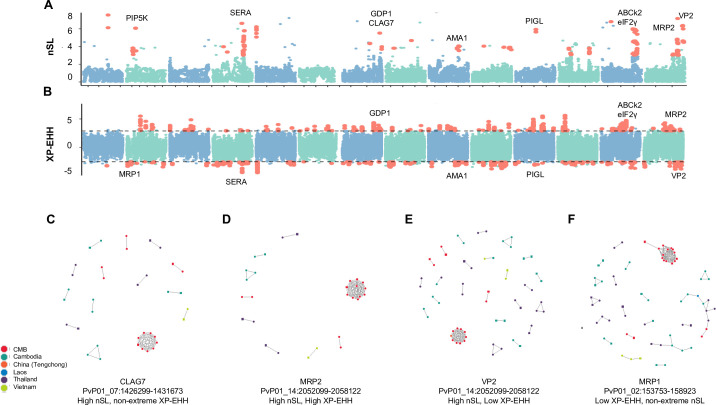
Fig 6. Signals of selective sweeps within the China-Myanmar border parasite population.
A) Signatures of selection across the genome wherein alternating blue and green colors denote separate chromosomes and red dots represent points which are in the top 1% and also have at least one neighboring SNP within 10 kb which is also in the top 1% of values. B) XP-EHH statistic. C-F) IBD networks for CLAG7 (C), MRP2 (D), VP2 (E), and MRP1 (F). Genes were chosen to represent different combinations of XP-EHH and nSL result status. Dots of different colors represent parasites from different countries (regions), respectively. Polyclonal samples have a square shape, while monoclonal samples have a round shape.

