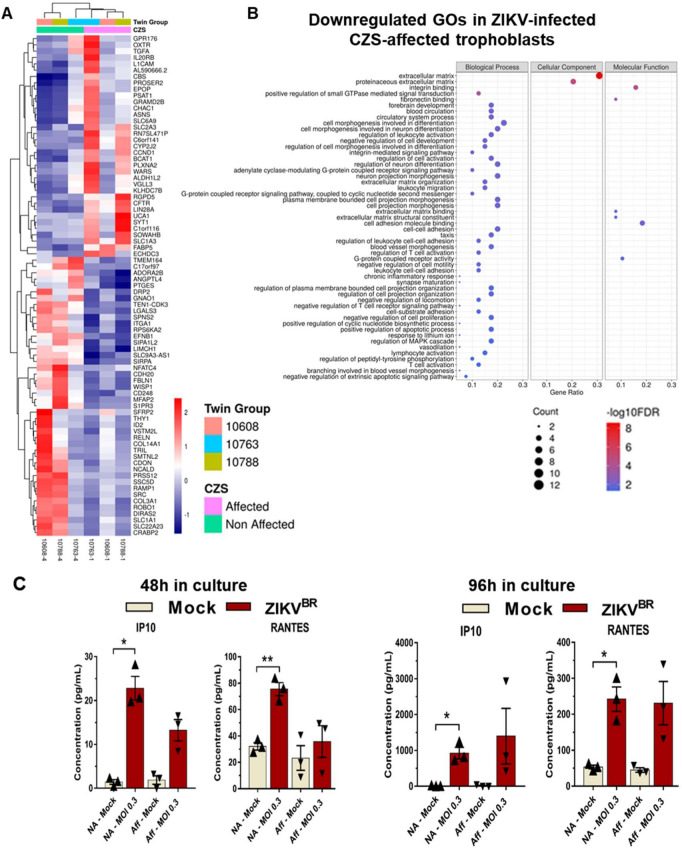
Fig 4. Differential response of hiPSC-derived trophoblast from CZS-affected and non-affected twins to ZIKVBR infection–gene expression and cytokines/chemokines secretion.
(A). Heatmap representation and unsupervised clusterization of differentially expressed genes (DEGs) (FDR < 0.05; edgeR exact test), one gene in each line, after ZIKVBR in vitro infection of trophoblasts from non-affected twins (green bar at top; samples #10608–4, #10763–4, #10788–4) as compared with trophoblasts from CZS-affected twins (pink bar at top; samples #10608–1, #10763–1, #10788–1) (one sample in each column, as indicated at the bottom). Color scale bar at right = Z score. (B). Gene Ontology terms enrichment analysis of downregulated genes in hiPSC-derived trophoblasts from CZS-affected twins when compared with trophoblasts from non-affected twins after ZIKVBR in vitro infection. The three major GO term categories, namely Biological Process, Cellular Component and Molecular Function are separately represented in each panel. The size of the circles is proportional to the number of genes in each significantly enriched category, as indicated at the scales in the lower part; the colors show the statistical significance of the enrichment, as indicated by the -log10 FDR values that appear in the color-coded scales at the bottom. A GO enrichment significance cutoff of FDR ≤ 0.05 was used. (C). Luminex quantitation of RANTES/CCL5 and IP10 detected in the culture supernatants of hiPSC-derived trophoblasts from non-affected twins or from CZS-affected twins at 48 h (left panels) or 96 h (right panels) after ZIKVBR infection. Data are represented as mean ± SEM and p-value * < 0.05 (Paired Student’s t test).

