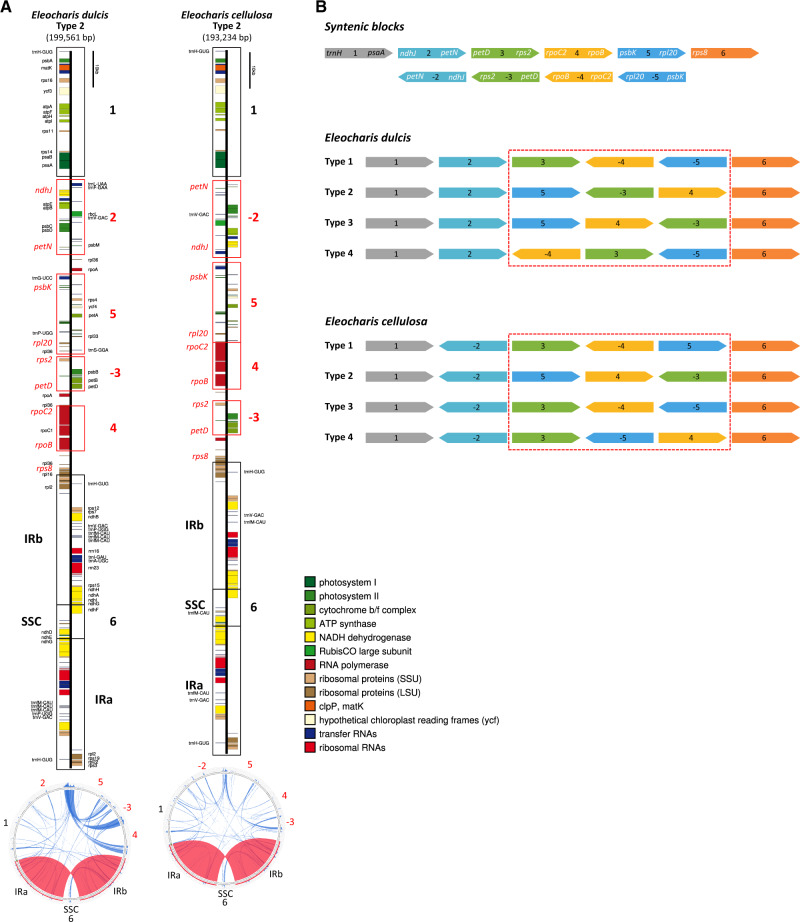
Fig. 1.
—Schematic representations of Eleocharis dulcis and E. cellulosa plastomes. (A) Unit-genome maps and repetitive DNA content of E. dulcis and E. cellulosa plastomes. Completed Eleocharis plastome sequences were submitted to OGDRAW (Lohse et al. 2013) to generate physical maps and Circoletto (Darzentas 2010) to visualize repetitive DNA. Structural type and plastome size (in parentheses) are shown below the species name. Syntenic blocks (numbered 1–6) detected by progressiveMauve (Darling et al. 2010) are depicted by open boxes; the negative symbol (–) indicates reverse-oriented strands relative to the reference (Typha). Red boxes indicate blocks that that vary in order among different structural types, whereas blocks encompassed by black boxes maintain their positions across types. Genes indicated in red font are located near the end of each syntenic block and were employed as annealing sites for PCR confirmation of plastome arrangements. The vertical black bar at the top of each linear map is provided for scale. The circular representation of each species is below each linear map with syntenic block numbers shown. Dispersed repeats and IR are shown within the circular map in blue and red, respectively. (B) Each syntenic block is illustrated with a different color and follows the same numbering convention as in (A). Representative genes near the end of each syntenic block are shown at the top. Gene symbols in white font indicate those in long-range PCR and correspond to the red gene symbols in (A). Different syntenic block arrangements are highlighted in red boxes for both Eleocharis species. IR, inverted repeat; SSC, small single copy region.

