. 2020 Jul 30;9:e56518. doi: 10.7554/eLife.56518

Figure 1. SEC-SAXS and SEC-SANS analysis of nanodiscs.

(A) SEC-SAXS (dark purple) and SEC-SANS (light purple) for ΔH5-DMPC nanodiscs at 10°C. The continuous curve show the model fit corresponding to the geometric nanodisc model shown in E. (B) SEC-SAXS (dark orange) and SEC-SANS (light orange) data for the ΔH4H5-DMPC nanodiscs at 10°C. (C,D) Corresponding pair-distance distribution functions. (E, F) Fitted geometrical models for the respective nanodiscs (drawn to scale relative to one another).

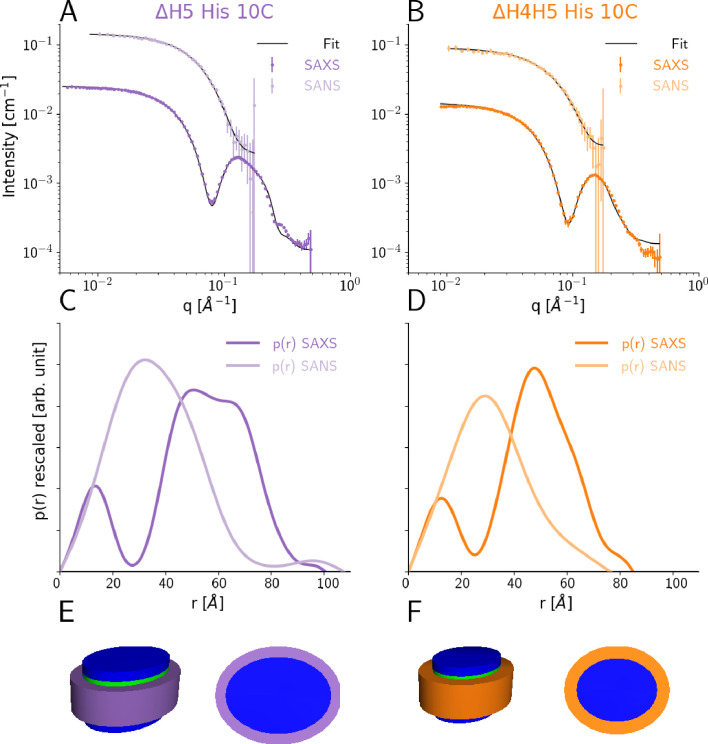
Figure 1.

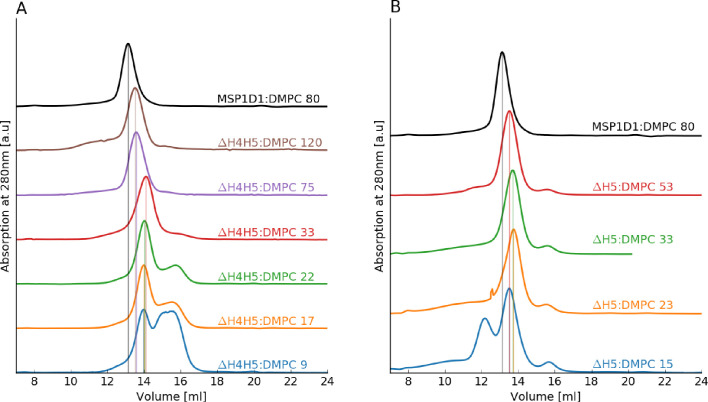
Figure 1—figure supplement 1. SEC analysis of the reconstitution of ΔH4H5 and ΔH5 nanodiscs with DMPC.

Figure 1—figure supplement 1.

(A) ΔH4H5 with DMPC at variable molar ratios of DMPC to ΔH4H5 with the molar stoichiometry indicated in the plot. (B) ΔH5 with DMPC at variable molar ratios of DMPC to ΔH4H5. In both plots, a reconstitution of MSP1D1:DMPC is inserted as reference (black line). The SEC analysis is performed using a GE Healthcare Life Science Superdex 200 10/300 GL column.
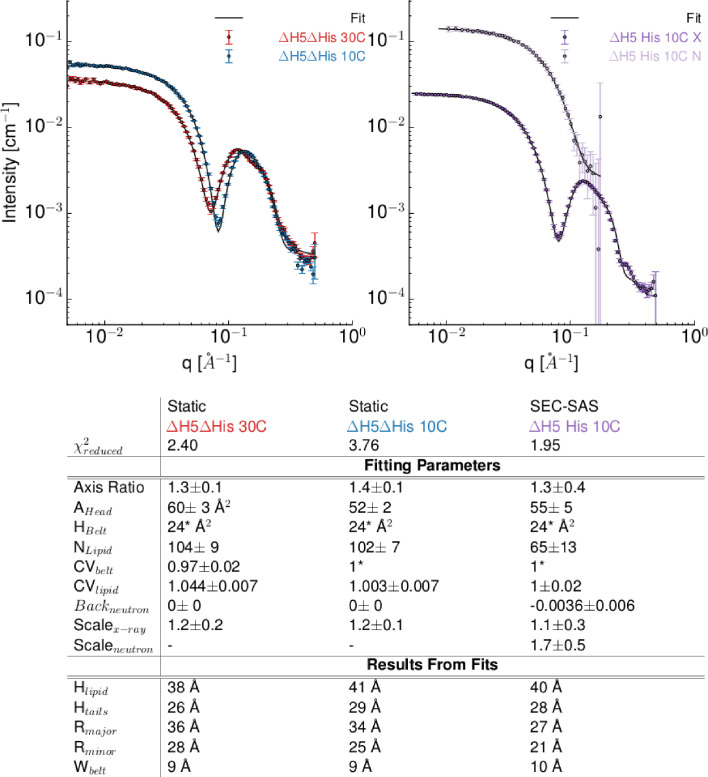
Figure 1—figure supplement 2. Model-based interpretation of the SAXS/SANS data on DMPC based nanodiscs obtained under different conditions.

Figure 1—figure supplement 2.

Top left) SAXS data from ΔH5ΔHis (I.e. ΔH5 with removed his-tags) obtained at 30°C (red) and 10°C (blue). Experimental data (points) and model fits (full lines). Top right) His-tagged ΔH5-DMPC nanodiscs measured at 10°C with SEC-SAXS (dark violet) and SEC-SANS (light violet). Data were fitted with the analytical model for nanodiscs with elliptical cross-section (see description in main article). Bottom) Table with the parameter values of the shown best model fits for the different samples. In all cases, that is, with/without His-tag and below and above the DMPC melting temperature, we found an axis ratio of the formed discs different from unity (between 1.2 and 1.4). Hence neither the variation of temperature nor the removal of the His-tag affects the overall conclusion that the elliptically-shaped nanodiscs describe the obtained small-angle scattering data.
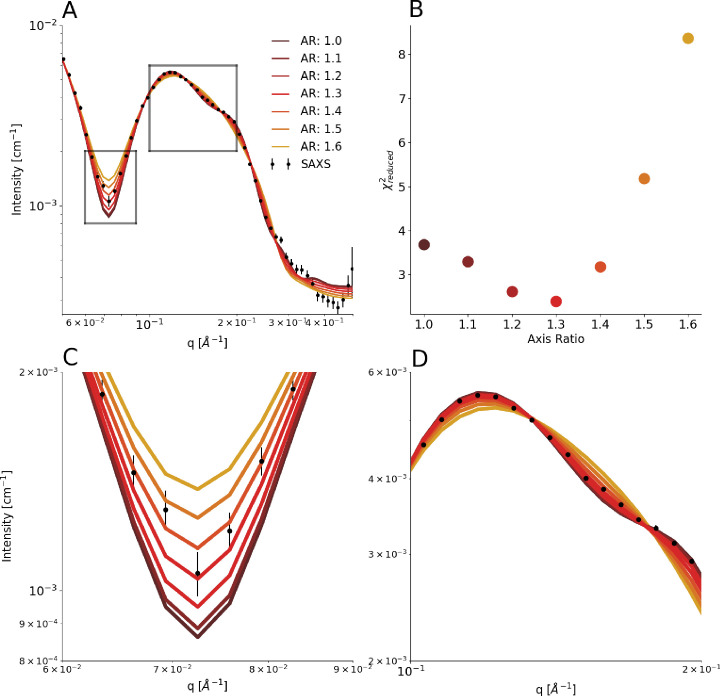
Figure 1—figure supplement 3. Varying the axis ratio in the model.

Figure 1—figure supplement 3.

We repeated the parameterization of the coarse-grained model by scanning a range of fixed values of the axis ratio and refitted the remaining parameters to optimize the fit. (A) Comparison between experimental SAXS data and those calculated from the model with different values of the axis ratio (AR). (B) Quantification of the agreement between experiment and model. (C and D) show zoom ins on regions highlighted in A.
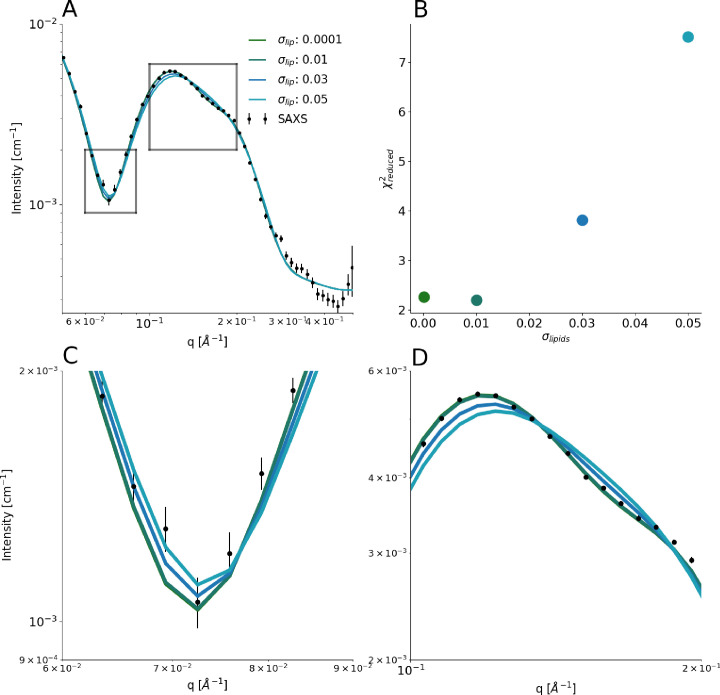
Figure 1—figure supplement 4. Introducing polydispersity in the model.

Figure 1—figure supplement 4.

We implemented a model for the nanodiscs that included a normally distributed dispersity around the average number of embedded lipids, where the width of the Gaussian was defined by its relative standard deviation in the number of embedded lipids, σlip, and truncated the Gaussian at ±3σlip. An upper hard limit for the number of lipids in the distribution was furthermore defined by the value that yielded circular and hence fully loaded discs. A lower hard limit was defined by the value that yielded discs with axis ratios exceeding 2. (A) Comparison between experimental SAXS data and those calculated from the model with different values of σlip, with σlip=10-4 representing a monodisperse system. (B) Quantification of the agreement between experiment and model. (C and D) show zoom ins on regions highlighted in A.