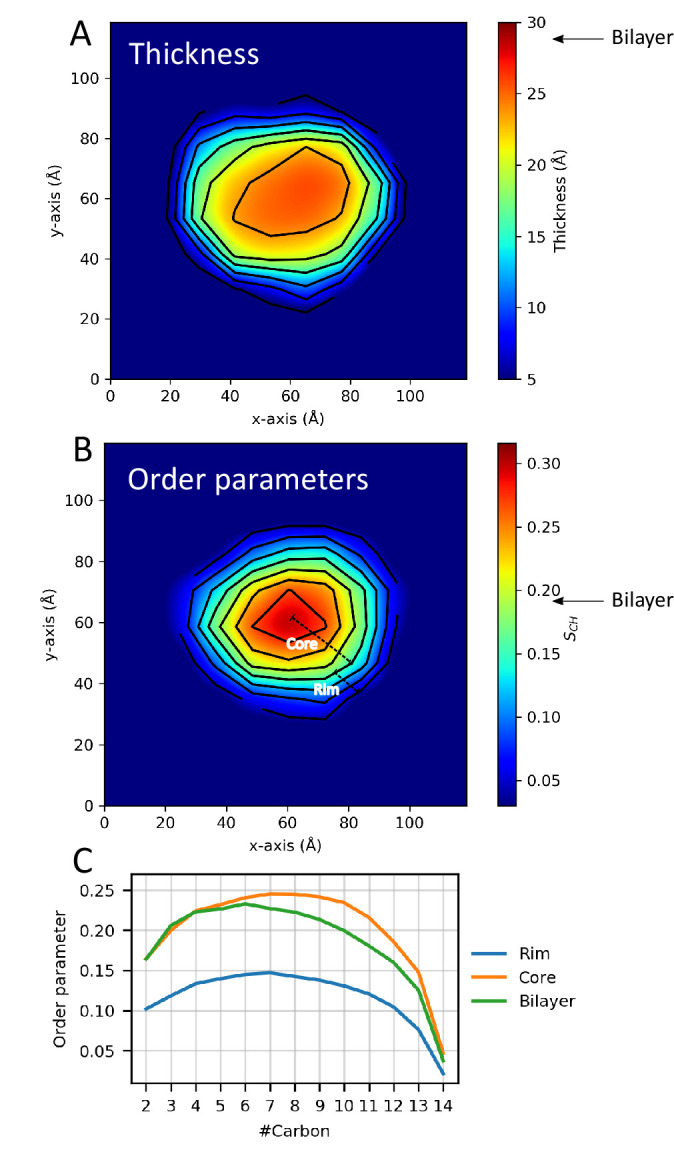
Figure 4. Lipid properties from simulations.

2D plots of the (A) thickness and (B) order parameters averaged over the ensemble and all C-H bonds in the two aliphatic tails of the DMPC lipids in the ΔH5 nanodisc. The core and rim zones are indicated in panel B. Arrows indicate the average value in simulations of a DMPC bilayer. (C) The order parameters as a function of carbon number in the lipid tails in the ΔH5-DMPC disc. The rim zone is defined as all lipids within 10 Å of the MSPs, while the core zone is all the lipids not within 10 Å of the MSPs.
