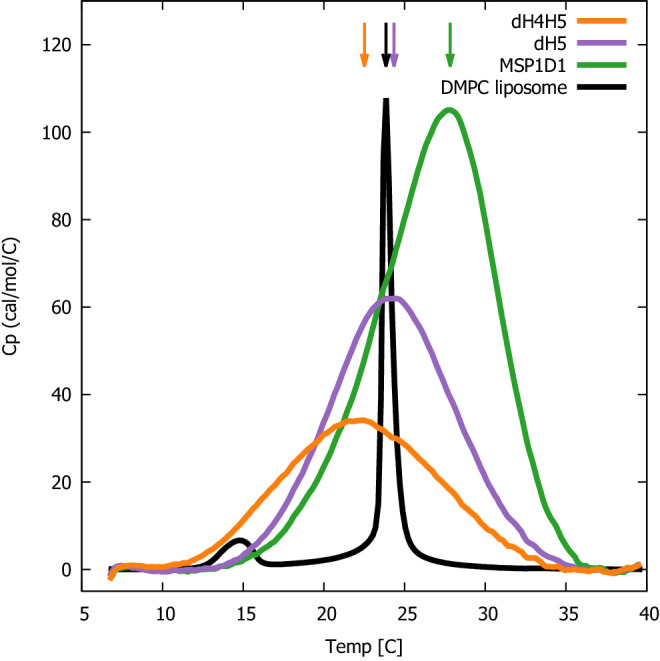
Figure 5. DSC analysis of lipid melting in nanodiscs.

The three DMPC-filled nanodiscs studied, listed by increasing size, are ΔH4H5-DMPC (orange), ΔH5-DMPC (purple) and MSP1D1-DMPC (green). DSC data from plain DMPC-vesicles (black) are shown for comparison. Arrows indicate the temperature with maximal heat capacity. DSC data from the three nanodisc samples are normalized by DMPC concentration, while the data from the DMPC liposome is on an arbitrary scale.
