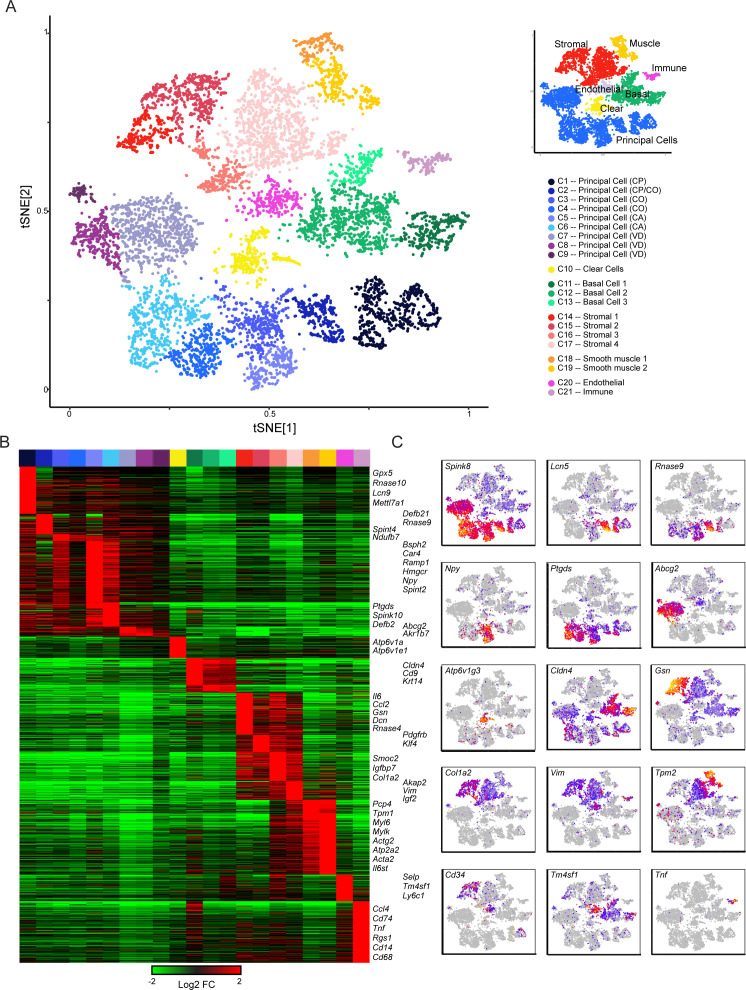
Figure 2. Single-cell decomposition of the epididymis.
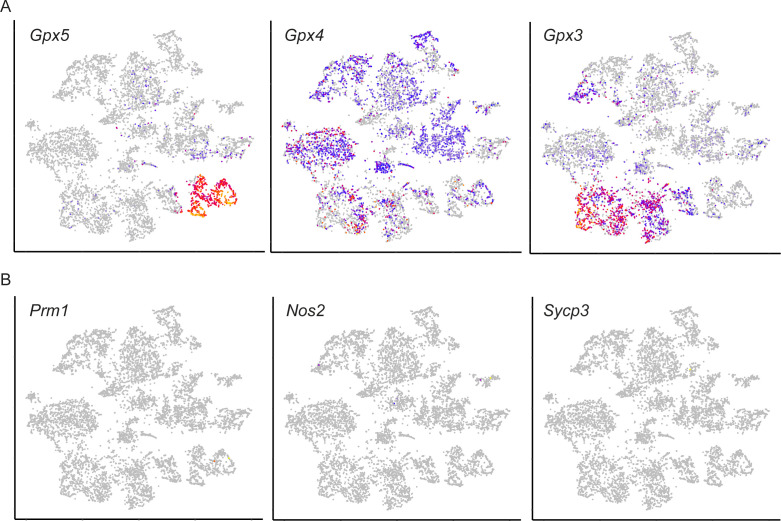
(A) Single-cell cluster (expanded from Figure 1C) with 21 clusters annotated according to predicted cell types. Inset shows coarser cell type groupings used for downstream subclustering. (B) Heatmap of genes enriched in each cluster. Among the genes exhibiting significant variation across the 21 clusters, 1241 genes enriched at least fourfold in at least one cluster were selected for visualization. Heatmap shows these genes sorted according to the cluster where they exhibit maximal expression. (C) Expression of key marker genes across the entire dataset. See also Figure 2—figure supplement 1. For this and other single-cell images, color scale runs from gray (no expression) through blue, then red and finally orange (highly expressed), with heatmap for each panel scaled according to expression level of the gene in question.


