In order to explore cell-to-cell variability in mRNA abundance between individual cells comprising any given principal cell subcluster, we set out to identify the fraction of cells in each subcluster expressing any given gene. However, the low efficiency of mRNA capture in scRNA-Seq makes it difficult to distinguish ‘true zeroes’ – cases where a given cell does not express a gene – from technical dropouts resulting from failure to capture any molecules of the gene in question. To address this, we used DESingle (
Miao et al., 2018) to estimate the true fraction of expressing cells for any given gene by inferring statistical likelihood of technical dropouts. Full dataset for this analysis is included as
Supplementary file 3. (
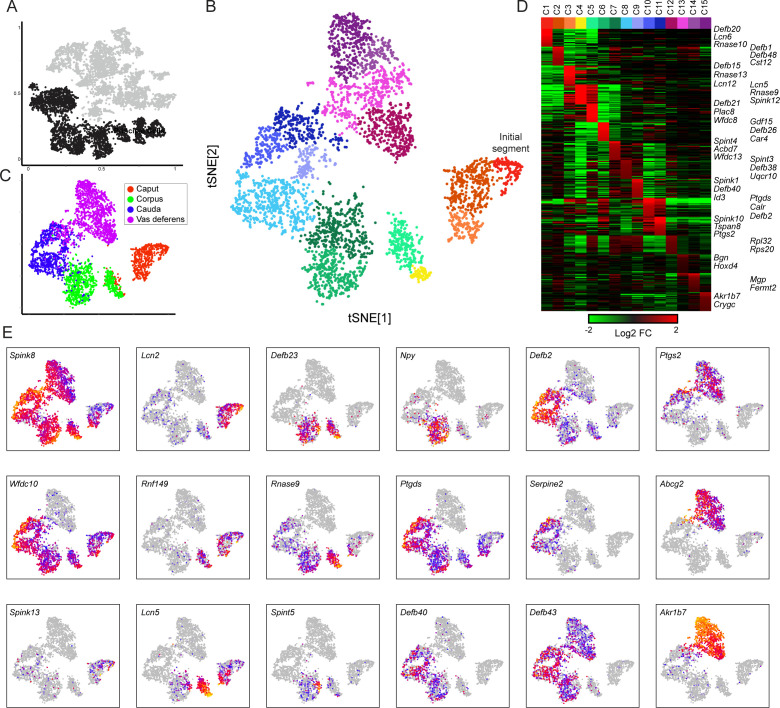
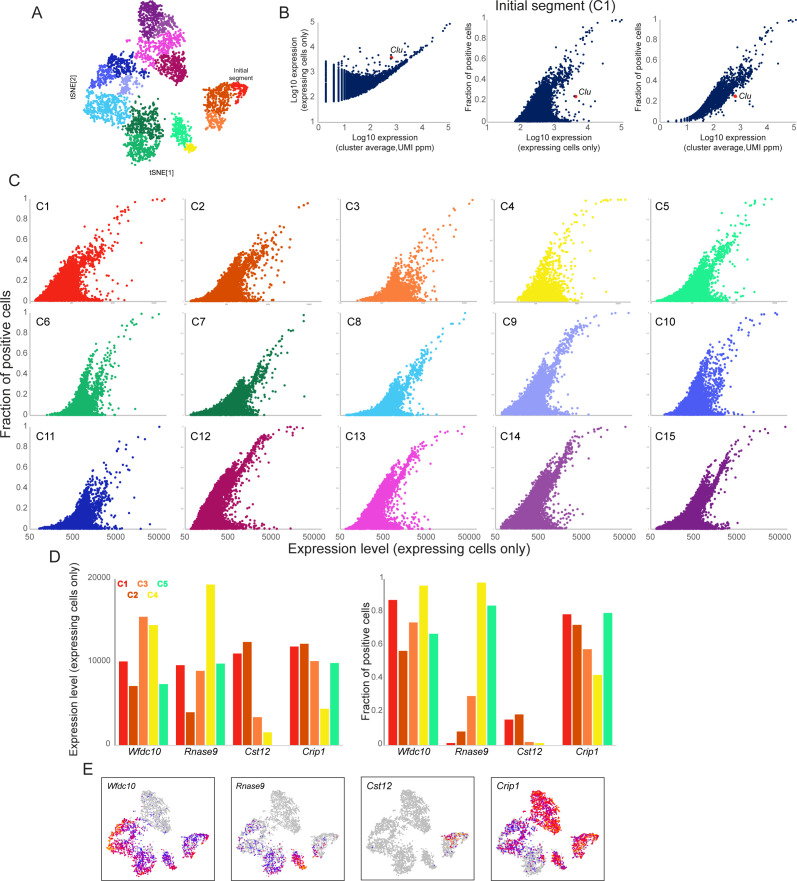
A) Principal cell clusters 1-15, reproduced from
Figure 3B. (
B) Using the output of DESingle, three plots show the relationship between gene expression level and fraction of expressing cells, using the principal cell subcluster corresponding to the initial segment (C1) for illustration. Left panel shows average expression level (across all cells in the cluster) on the x axis, expressed as UMIs normalized to parts per million, compared to expression level only in the subset of cells that detectably express the gene. At high expression levels, these values converge, indicating that extremely highly expressed genes are generally consistently detected throughout the cell population, whereas at lower average expression many genes fall above the diagonal, highlighting genes expressed in only a subset of cells. Middle and right panels compare a gene’s expression level (either confined only to expressing cells, or across all cells in the cluster, as indicated) to the fraction of expressing cells.
Clu is shown in all three panels to highlight an example of high cell-to-cell variation for a gene known to exhibit patchy expression in the caput epididymis (
Hermo et al., 1991). (
C) Scatterplots for all 15 principal cell subclusters, comparing gene expression level only in expressing cells (x axis) to fraction of expressing cells (y axis). Substantial cell-to-cell heterogeneity can be observed across all subclusters – in general, genes located in the lower right area of these graphs represent highly expressed genes with unusually high cell-to-cell variability. See also
Supplementary file 3. (
D-E) Illustrative examples of genes exhibiting similar abundance in expressing cells (plotted in left panel of (D) for the first five principal cell clusters), but with different behaviors across cells (right panel, (D)). Expression across all principal cell subclusters is illustrated in (
E) for all four genes.
Wfdc10 and
Crisp1 are both consistently expressed in the majority of cells in all five subclusters, and are typical examples of highly expressed genes.
Rnase9 is a marker of clusters 4–5 and is penetrantly-expressed in these clusters. Importantly, a small number of
Rnase9-positive cells can be detected in the more proximal clusters 1–3, and, interestingly, these rare cells express
Rnase9 at similar levels to cells in clusters 4–5. Finally,
Cst12 is one of the markers of cluster 2, yet even in this cluster only a small subpopulation of cells express this gene.

