. 2020 Aug 13;9:e57936. doi: 10.7554/eLife.57936

Figure 1. Outcrossed S. pombe diploids frequently produce disomic spores.

(A) Schematic of the experimental approach. The ade6 gene is linked to centromere 3. The karyotypes of JB1172, CBS5680, and JB844 are unknown, but outside of an inversion on Sp chromosome 1, Sp likely represents the ancestral karyotype (Avelar et al., 2013; Brown et al., 2011). (B) Phenotypes of heterozygous or homozygous S. pombe diploids. Allele transmission of chromosome 3 was assayed using co-dominant markers at ade6 (ade6+ and ade6Δ::hphMX6). The ade6+ allele confers an Ade+ phenotype, while the ade6Δ::hphMX6 provides resistance to Hygromycin B (HygR). Heterozygous aneuploid or diploid spores are Ade+ HygR. The fertility was measured using the viable spore yield assay to determine the number of viable spores per viable diploid. In the absence of drive, we expect 50% of the spores to be Ade+ HygS. A significant departure from 50% indicates drive favoring the overrepresented allele. The phenotypes of each heterozygote were compared to those of homozygous diploids from both parental strain backgrounds. * indicates p-value<0.025 (G-test [Ade+ HygR spores] and Wilcoxon test [fertility]) for the heterozygotes relative to the homozygous diploids from both parental backgrounds. Diploid 7 was only significantly different (p-value<0.025) in the frequency of Ade+ HygR spores when compared to diploid 9, but not when compared to diploid 12. This is indicated with #. To detect biased allele transmission (Ade+ HygS), diploids 2–4 were compared to diploid 8 and diploids 5–7 were compared to diploid 9. * indicates p-value<0.05 (G-test [allele transmission]). More than 200 viable spores were scored for each diploid. Raw data can be found in Figure 1—source data 1 and Figure 1—source data 2. (C) Representative images of the viable spore colonies generated by homozygous Sk and JB1172 diploids and heterozygous Sk/JB1172 diploids. Images of colonies generated by other diploids are shown in Figure 1—figure supplement 2.

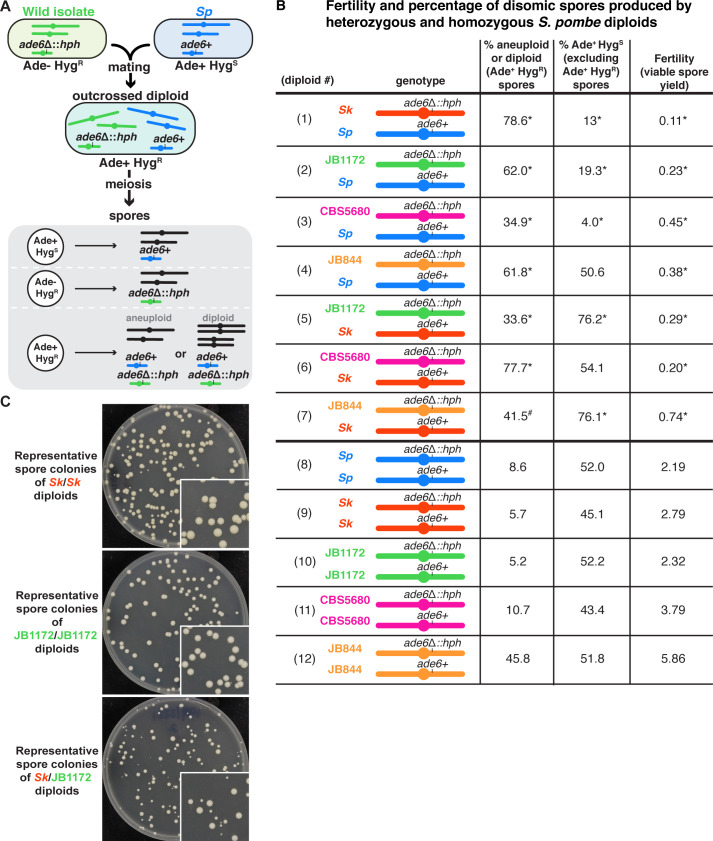
Figure 1—source data 1. Raw data for the viable spore yield reported in Figure 1.
Each column represents the diploid assayed, which matches the diploid number in Figure 1. The second row shows the diploid number. The third row shows the SZY strain numbers of both haploid parent strains. We present all the viable spore yield values from independent assays. We calculated the p-value using the Wilcoxon test by comparing the heterozygous diploid to the homozygous parent 1 (p1) and parent 2 (p2) strains. Diploid one was compared to control diploids 8 (p1) and 9 (p2); diploid two was compared to control diploids 8 (p1) and 10 (p2); diploid three was compared to control diploids 8 (p1) and 11 (p2); diploid four was compared to control diploids 8 (p1) and 12 (p2); diploid five was compared to control diploids 9 (p1) and 10 (p2); diploid six was compared to control diploids 9 (p1) and 11 (p2); and diploid seven was compared to control diploids 9 (p1) and 12 (p2). The last two rows show the relative fertility (f) when compared to the homozygous parent 1 and parent 2.
Figure 1—source data 2. Raw data of allele transmission values reported in Figure 1.
Each of the rows represents the relevant genotype and allele transmission of the indicated diploid. The first column matches the diploid number from Figure 1. Columns 2–5 contain the SZY strain number and relevant genotypes used to determine the allele transmission for chromosome 3. Columns 6–8 indicate the number of spores that exhibited the indicated phenotype. The total number of spores assayed is shown in column 9. Column 10 indicates the percentage of disomic spores (Ade+ HygR). Column 11 indicates the p-values calculated when comparing the frequency of Ade+ HygR spores produced by heterozygous diploids to the frequency of Ade+ HygR spores produced by both homozygous diploid parent strains. Diploid one was compared to control diploids 8 and 9; diploid two was compared to control diploids 8 and 10; diploid three was compared to control diploids 8 and 11; diploid four was compared to control diploids 8 and 12; diploid five was compared to control diploids 9 and 10; diploid six was compared to control diploids 9 and 11; and diploid seven was compared to control diploids 9 and 12. Column 12 shows the percentage of the spores that were Ade+ HygS (excluding Ade+ HygR spores). Column 13 indicates the p-value calculated when comparing diploids 2–4 to diploid 8 and diploids 5–7 to diploid 9. The last column shows the total number of independent diploids assayed for each cross.

Figure 1.

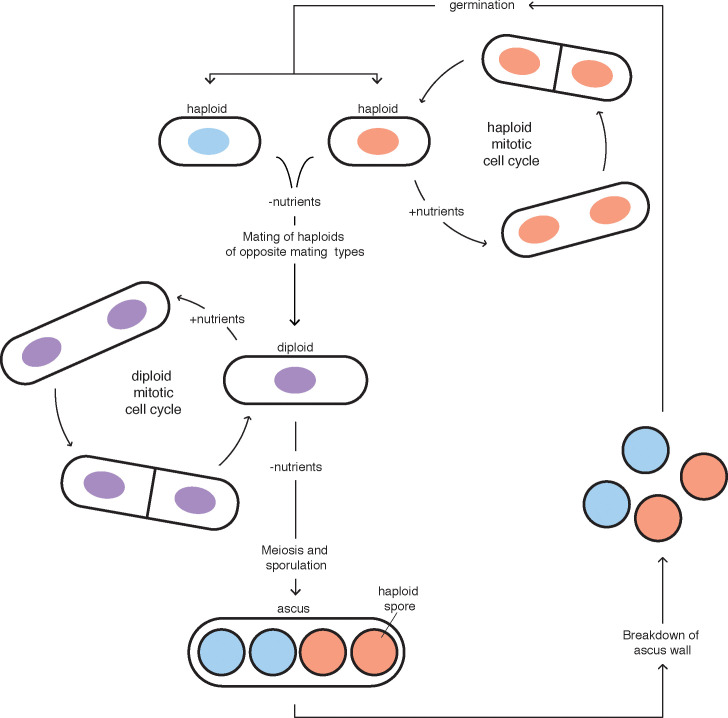
Figure 1—figure supplement 1. The Schizosaccharomyces pombe life cycle.

Figure 1—figure supplement 1.

The red and blue colors represent nuclei of cells with different mating types (i.e. h+ and h-). Mating and meiosis are induced after nutrient depletion in S. pombe. This figure was adapted from Egel, 2004.
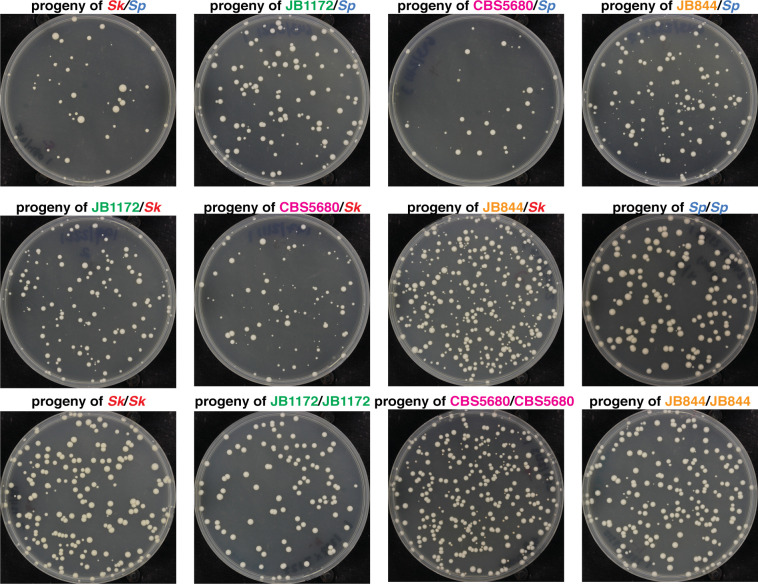
Figure 1—figure supplement 2. Colony phenotypes of spores produced by S. pombe heterozygous and homozygous diploids.

Figure 1—figure supplement 2.

Representative images of the spore colonies generated by the indicated diploids. Sk/Sk, JB1172/JB1172, and Sk/JB1172 images are the same as those presented in Figure 1C.
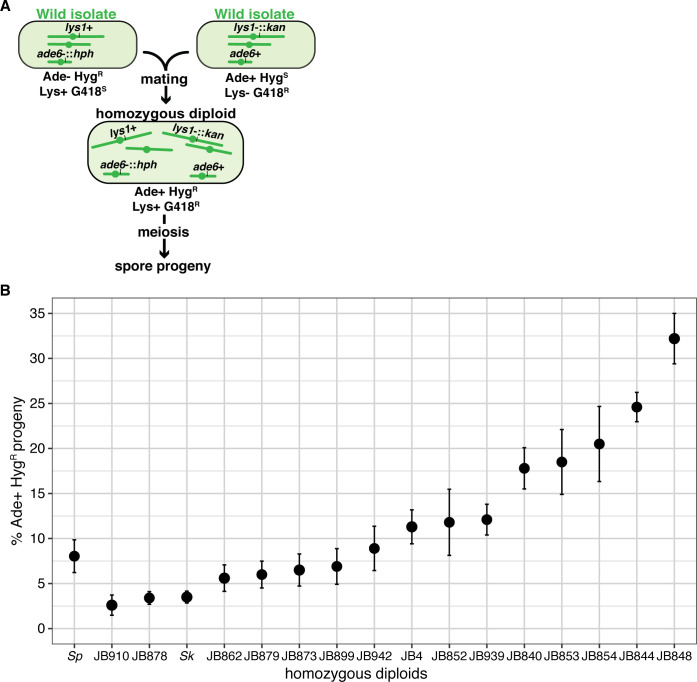
Figure 1—figure supplement 3. Homozygous S. pombe diploids generate variable frequencies of disomic spores.

Figure 1—figure supplement 3.

(A) Schematic of the experimental approach used in (B). The ade6 marker is linked to centromere 3. (B) Phenotypes of homozygous S. pombe diploid strains. Allele transmission of chromosome three was assayed using co-dominant markers at ade6 (ade6+ and ade6-::hphMX6). The ade6+ allele confers an Ade+ phenotype, while the ade6-::hphMX6 cassette provides resistance to Hygromycin B (HygR). The error bars represent the standard error of the mean for each strain. Heterozygous aneuploid or diploid spores inherit both markers and are thus Ade+ HygR. More than 200 viable spores were scored for each diploid and at least three independent diploids were assayed. Raw data are shown in Figure 1—figure supplement 3—source data 1.
Figure 1—figure supplement 3—source data 1. Raw data of allele transmission values reported in Figure 1—figure supplement 3.
Each of the rows represents the relevant genotype and allele transmission of the indicated diploid. The first column shows the S. pombe diploid assayed. In columns 2–5 are the SZY strain number and relevant genotypes used to determine the allele transmission for chromosome 1 and chromosome 3. Columns 6–12 indicate the number of spores that exhibited the indicated phenotypes. The total number of spores assayed is shown in column 13. Column 14 indicates the percentage of the spores that were likely disomes (Ade+ and HygR). Column 15 indicates the percentage of the spores (shown in column 8) that were Ade+ HygS. Ade+ HygR spores were excluded to calculate these percentages. The last column shows the total number of independent diploids assayed for each cross.