. 2020 Aug 13;9:e57936. doi: 10.7554/eLife.57936

Figure 2. A high fraction of viable spores are disomic in Sk strains with wtf competition at two loci.

(A) Model for a diploid heterozygous for distinct wtf meiotic drivers. Spores are destroyed by any wtf driver that they do not inherit from the diploid progenitor cell. Meiosis I chromosome missegregation is one mechanism by which spores can inherit wtf alleles on competing haplotypes and survive. (B) Schematic of the genetic markers at ura4 and ade6 in the control diploid and the wtf transgenes inserted at ura4 and ade6 in Sk chromosome 3 in the double driver heterozygote. wtf genes from the Sp, Sk, and FY29033 strains are depicted in blue, red, and green, respectively. The wtf drivers shown here drive when heterozygous and do not counteract the effect of the other drivers (see Figure 2—figure supplement 1). (C) Phenotypes of the double driver heterozygote or control diploid in rec12+ (top) and rec12Δ (bottom) strain backgrounds. We expect NatR HygS spores to be present at 50% in the viable population. A significant departure from the expected 50% indicates drive favoring the overrepresented allele. For statistical analyses, the frequency of disomic spores, allele transmission, and fertility in the double driver heterozygotes was compared to the control diploids. Diploid 13 was compared to control diploid 14, and diploid 15 was compared to control diploid 16. * indicates p-value<0.05 (G-test [allele transmission and NatR HygR spores] and Wilcoxon test [fertility]). The data for diploid 14 were previously published in Bravo Núñez et al., 2020. Raw data can be found in Figure 2—source data 1 and Figure 2—source data 2.

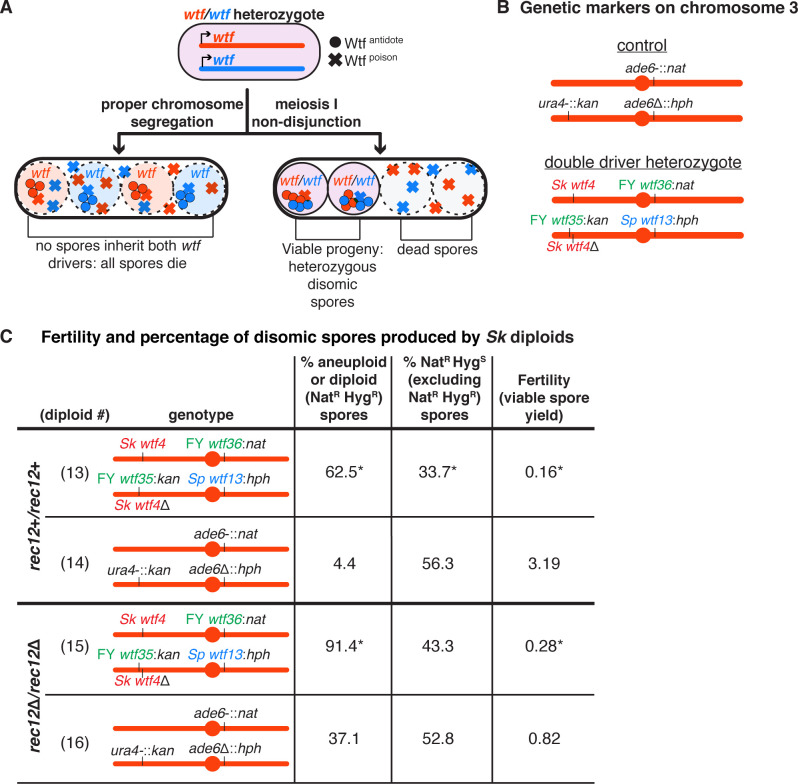
Figure 2—source data 1. Raw data of allele transmission values reported in Figure 2, Figure 2—figure supplement 1, Figure 2—figure supplement 2, and Figure 2—figure supplement 3.
Each of the horizontal lines represents the relevant genotype and allele transmission of the indicated diploid. The first column matches the diploid number from Figure 2, Figure 2—figure supplement 1, Figure 2—figure supplement 2, and Figure 2—figure supplement 3. In columns 2–5 are the SZY strain number and relevant genotypes used to determine the allele transmission for chromosome 3. Columns 6 and 7 show the indicated the number of ura+ or ura- spores excluding disomes. Columns 9–11 indicate the number of haploid spores that exhibited the indicated phenotype. Column 15 indicates the total number of spores assayed excluding NatR HygR and G418R HygR spores. Column 16 indicates the total number of spores assayed. Column 17 shows the total number of independent diploids assayed for each cross. Columns 18 and 19 indicate the p-values calculated with a G-test when comparing diploids 13, 33–35, and 41–43 to control diploid 14; diploid 15 to control diploid 16; diploid 44 to control diploid 45; and diploids 24, 31, 32, 36–40, and 46 to control diploid 23. We found 44 additional colonies for diploid 46 that lacked both markers at ade6. The diploid numbers carry over between figures, meaning that the raw data for diploids 23 and 24 are also presented in Figure 4—source data 1 and Figure 6—source data 1. The data for diploids 14 and 23 were previously published in Bravo Núñez et al., 2020.
Figure 2—source data 2. Raw data of viable spore yield assays reported in Figure 2, Figure 2—figure supplement 1, Figure 2—figure supplement 2, and Figure 2—figure supplement 3.
Each column represents the diploid assayed, which matches the diploid number in Figure 2, Figure 2—figure supplement 1, Figure 2—figure supplement 2, and Figure 2—figure supplement 3. The first row of each table indicates in which figure these data are reported. The second row shows the diploid number. The third row shows the SZY strain numbers of both haploid parent strains. We present all of the viable spore yield values from independent assays. We calculated the p-value using the Wilcoxon test by comparing diploids 13, 33–35, and 41–43 to control diploid 14; diploid 15 to control diploid 16; diploid 44 to control diploid 45; and diploids 24, 31, 32, 36–40, and 46 to control diploid 23. The diploid numbers carry over between figures, meaning that the raw data for diploids 23 and 24 are also presented in Figure 4—source data 2 and Figure 6—source data 2. The data for diploids 14 and 23 were previously published in Bravo Núñez et al., 2020.

Figure 2.

Figure 2—figure supplement 1. Wtfantidote proteins are generally specific for a Wtfpoison and do not provide cross-resistance to other Wtfpoison proteins.

Figure 2—figure supplement 1.

(A) Summary of interactions between distinct wtf meiotic drivers. Due to the low fertility observed in the diploids with competing wtf meiotic drivers compared to the fertility of diploids with hemizygous wtf drivers, we concluded that the antidote of a given wtf driver does not provide resistance to a different poison. (B) Phenotypes of Sp and Sk diploids containing heterozygous wtf meiotic drivers or containing competing wtf meiotic drivers. For statistical analyses, the frequency of disomic spores, allele transmission, and fertility in the diploids with hemizygous or competing wtf drivers was compared to the control diploids. Diploids 31, 32, and 36–40 were compared to control diploid 23, and diploids 33–35 and 41–43 were compared to control diploid 14. * indicates p-value<0.05 (G-test [allele transmission and NatR HygR or G418R HygR spores] and Wilcoxon test [fertility]). The data for diploids 14 and 23 were previously published in Bravo Núñez et al., 2020. The diploid numbers carry over between figures, meaning that the data for diploids 14 and 23 are repeated from Figure 2 and Figure 4, respectively. Raw data can be found in Figure 2—source data 1 and Figure 2—source data 2.
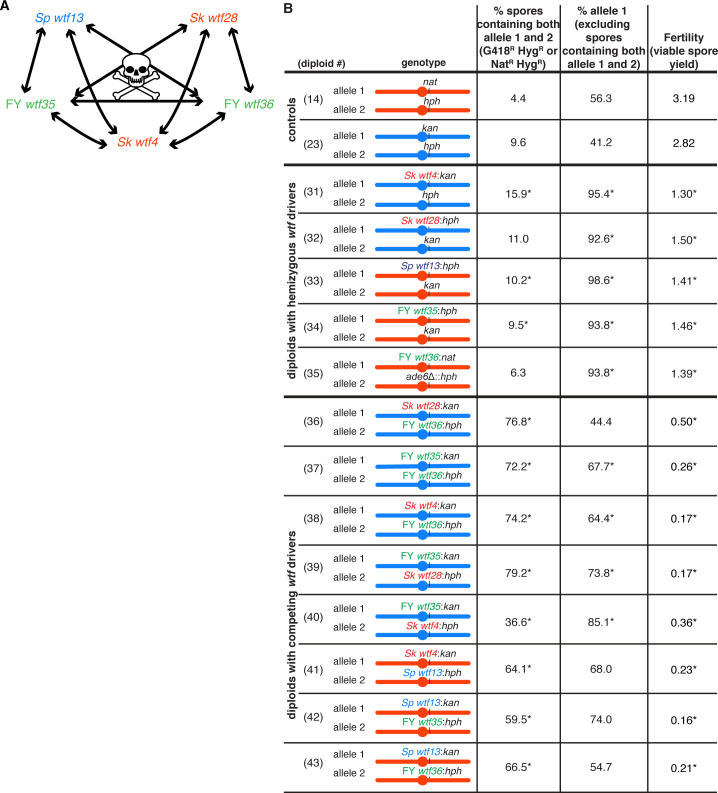
Figure 2—figure supplement 2. Sp diploids with wtf competition at two loci have a high fraction of viable spores that are disomic.

Figure 2—figure supplement 2.

(A) Schematic of the genetic markers utilized in the control diploid and the double driver heterozygote in the Sp strain background. (B) Allele transmission and fertility of Sp diploids is shown. The allele transmission at ade6 was determined using co-dominant markers (natMX4 and hphMX6). We expect NatR HygS spores to be present at 50% in the population. A significant departure from the expected 50% indicates drive favoring the overrepresented allele. For statistical analysis, the frequency of disomic spores, allele transmission, and fertility from diploid 44 was compared to control diploid 45. * indicates p-value<0.05 (G-test [% NATR HygR spores and allele transmission] and Wilcoxon test [fertility]). Raw data can be found in Figure 2—source data 1 and Figure 2—source data 2. The low viable spore yield of diploid 45 relative to diploid 8 is likely due to double auxotrophy of this strain and the fact that all the experiments used unsupplemented SPA media (see Materials and methods).
Figure 2—figure supplement 3. wtf poison-only alleles do not enrich for disomes in viable spores.

Figure 2—figure supplement 3.

Disomy frequencies and fertility of Sp diploids are shown. The frequency of disomy was determined using co-dominant markers at ade6. For statistical analyses, we compared diploids 24 and 46 to control diploid 23. * indicates p-value<0.05 (G-test [% spores containing both allele 1 and allele 2] and Wilcoxon test [fertility]). The data for diploid 23 were previously published in Bravo Núñez et al., 2020. The diploid numbers carry over between figures, meaning that the data for diploids 23 and 24 are repeated from Figure 4. The raw data can be found in Figure 2—source data 1 and Figure 2—source data 2. For diploid 46, 44 additional colonies were recovered that lack both markers.
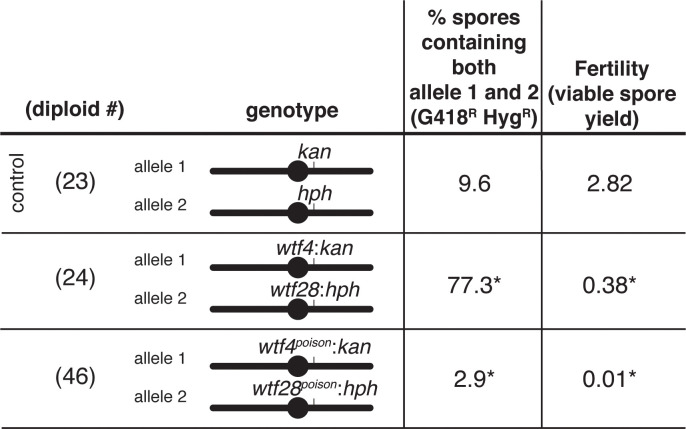
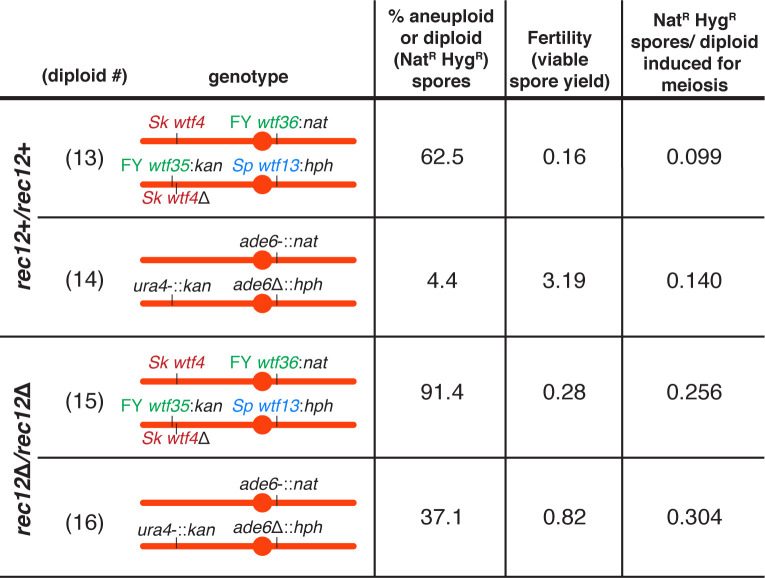
Figure 2—figure supplement 4. Competing wtf meiotic drivers do not affect the frequency of disomes generated per meiosis.

Figure 2—figure supplement 4.

To calculate the number of aneuploid and diploid spores per meiosis from the diploids presented in Figure 2C, we multiplied the fraction of NatR HygR spores (disomes) by the viable spore yield (viable spores/viable diploid cells induced to undergo meiosis). This gave the number of NatR HygR spores produced per diploid cell induced to undergo meiosis.
Figure 2—figure supplement 5. The recombination frequency is altered in Sk diploids with competing wtf meiotic drivers.

Figure 2—figure supplement 5.

To determine the recombination frequency (R) within the ade6 and ura4 interval in diploids 13 and 14 presented in Figure 2, we calculated the number of recombinants/(number of parental and recombinant spores). To calculate the genetic distance (cM), we used Haldane’s formula x = −50 ln(1–2R) (Haldane, 1919; Smith, 2009). * indicates p-value=0.03 (G-test). The recombination frequency of diploid 13 was compared to the recombination frequency of diploid 14.