. 2020 Aug 13;9:e57936. doi: 10.7554/eLife.57936

Figure 3. wtf meiotic driver competition contributes to the high disomy in spores produced by Sp/Sk mosaic diploids.

(A) Schematic of the predicted wtf meiotic drivers found on chromosome 3 of the Sp/Sk mosaic diploid. Sp-derived DNA is depicted in blue and Sk-derived DNA in red. (B) Phenotypes of mosaic and control diploids in rec12∆/rec12∆ and rec12+/rec12∆ backgrounds. Allele transmission of chromosome 3 was assayed using markers at ade6 (linked to centromere 3). In the absence of drive, we expect 50% of the spores to be Ade- HygR. Any significant deviation from the expected 50% indicates drive favoring the overrepresented allele. To determine the contribution of wtf meiotic drivers to the frequency of disomic spores and fertility, diploid 18 was compared to diploid 17, and diploid 21 was compared to diploid 20. To determine if there was biased allele transmission, diploids 17 and 18 were compared to control diploid 19, and diploids 20 and 21 were compared to control diploid 22. More than 300 viable spores were scored for each diploid. * indicates p-value<0.05 (G-test [allele transmission and Ade+ HygR spores] and Wilcoxon test [fertility]). Raw data can be found in Figure 3—source data 1 and Figure 3—source data 2.

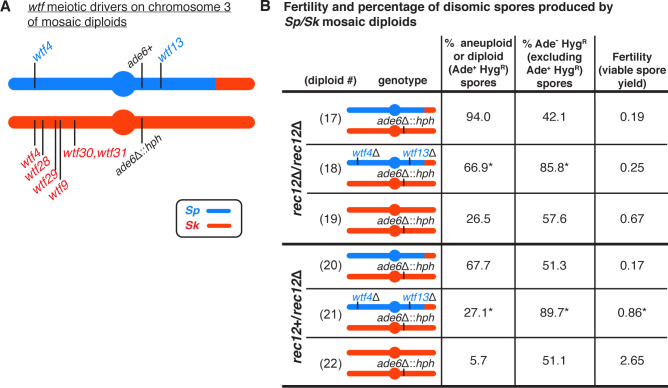
Figure 3—source data 1. Raw data of allele transmission values reported in Figure 3 and Figure 3—figure supplement 1.
Each of the rows represents the relevant genotype and allele transmission of the indicated diploid. The first column matches the diploid number from Figure 3 and Figure 3—figure supplement 1. In columns 2–5 are the SZY strain number and relevant genotypes used to determine the allele transmission for chromosome three in the Sp/Sk mosaic and control diploids. Column six shows the Rec12 phenotype for each diploid. Columns 7 and 8 indicate the number of spores that exhibited the indicated phenotype (Ade+ HygS or Ade- HygR, respectively). Column nine shows the number of spores that exhibited both phenotypes and are thus Ade+ and HygR. These spores are likely disomic. The total number of spores assayed is shown in column 10. Column 11 indicates the percentage of disomic spores (Ade+ and HygR). Column 12 indicates the p-values calculated when comparing diploids 18, 47, 48, and 49 to diploid 17, and diploids 21, 50, and 51 to diploid 20. Column 13 shows the percentage of the spores (excluding Ade+ HygR spores) that were Ade- HygR. Column 14 indicates the p-value calculated when comparing diploids 17, 18, and 47–49 to control diploid 19, and diploids 20, 21, 50, and 51 to control diploid 22. The last column shows the total number of independent diploids assayed for each cross.
Figure 3—source data 2. Raw data of viable spore yield reported in Figure 3 and Figure 3—figure supplement 1.
The top table shows the data for Figure 3. The bottom table shows the data for Figure 3—figure supplement 1. Each column represents the diploid assayed, which matches the diploid numbers in Figure 3 and Figure 3—figure supplement 1. The first row shows the figure where the data are reported. The second row shows the diploid number. The third row shows the SZY strain numbers of both haploid parent strains. We present all of the viable spore yield values from independent assays. We calculated the p-value using the Wilcoxon test by comparing diploids 18, 47, 48, and 49 to diploid 17, and diploids 21, 50, and 51 to diploid 20.

Figure 3.

Figure 3—figure supplement 1. Single deletions of Sp wtf meiotic drivers partially decrease the frequency of disomic spores produced by Sp/Sk mosaic diploids.

Figure 3—figure supplement 1.

Phenotypes of Sp/Sk mosaic and control diploids in rec12∆/rec12∆ and rec12+/rec12∆ backgrounds. Allele transmission of chromosome 3 was assayed using co-dominant markers at ade6 (ade6+ and ade6∆::hphMX6).). We expect that in the absence of drive, 50% of the spores will be Ade- HygR. Any significant deviation from the expected 50% indicates drive favoring the overrepresented allele. For statistical analyses of disomy and fertility, we compared diploids 18 and 47–49 to diploid 17, and diploids 21, 50, and 51 to diploid 20. For statistical analyses of allele transmission, we compared diploids 17, 18, and 47–49 to control diploid 19, and we compared diploids 20, 21, 50, and 51 to control diploid 22. * indicates p-value<0.05 (G-test [allele transmission, Ade+ HygR] and Wilcoxon test [fertility]). Raw data can be found in Figure 3—source data 1 and Figure 3—source data 2. Diploid numbers get carried over between figures, meaning that the data for diploids 17–22 are also presented in Figure 3.
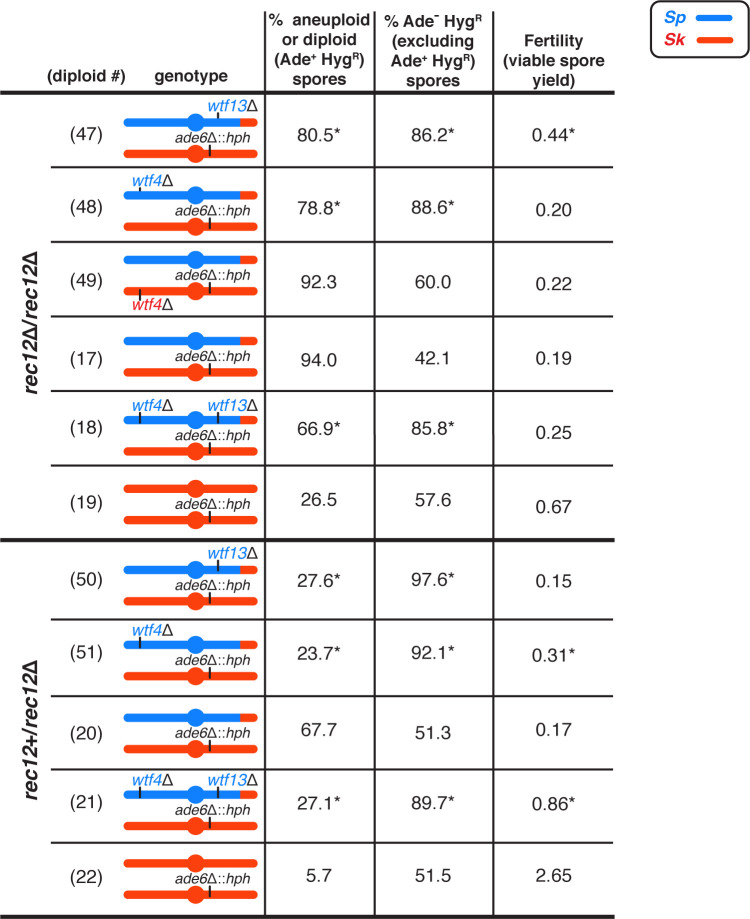
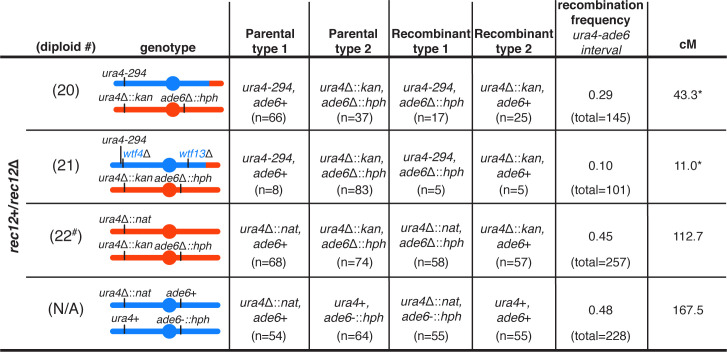
Figure 3—figure supplement 2. Observed recombination frequencies are altered by meiotic drive in Sp/Sk mosaic diploids.

Figure 3—figure supplement 2.

To determine the recombination frequencies (R) between ade6 and ura4 in Rec12+ diploids presented in Figure 3 (diploids 20, 21, and 22), and in an Sp homozygous control, we calculated the number of recombinant spores/(number of parental and recombinant spores). To calculate the genetic distance (cM), we used Haldane’s formula x = −50 ln(1–2R) (Haldane, 1919; Smith, 2009). The data for the Sp homozygous control was generated by crossing strains SZY2397 and SZY1180. * indicates p-value<0.05 (G-test). Diploids 20 and 21 were compared to diploid 22 (p-values=0.03 and 5.6e-07, respectively) and the Sp homozygote (p-values=0.01 and 1.5e-07, respectively). # indicates that in diploid 22, only the data from the cross between SZY320 and SZY293 were used to calculate the genetic distance between ade6 and ura4.