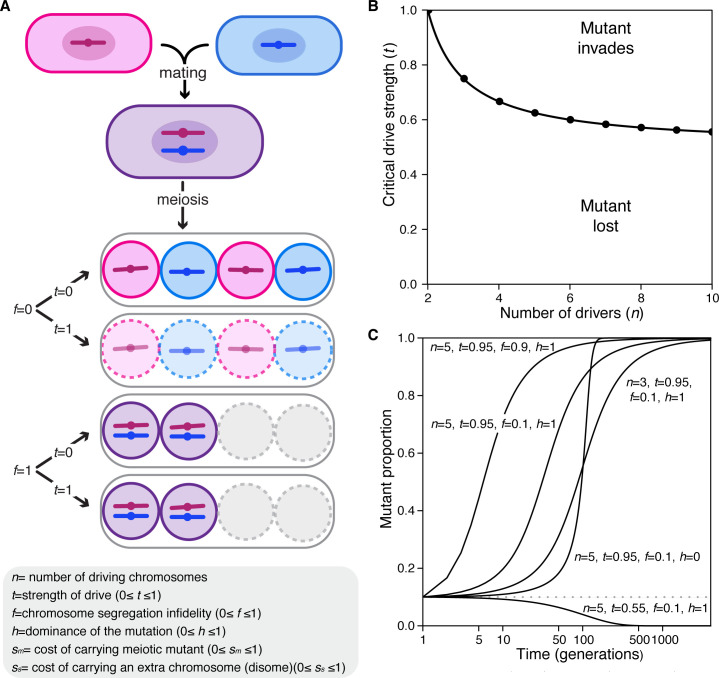
Figure 7. Population genetics of a meiotic mutant in response to meiotic drive.
(A) Schematic of the spore progeny generated by S. pombe diploids when the infidelity of chromosome segregation (f) is 0 or 1 and the strength of drive (t) is 0 or 1. (B) Critical drive strength (tcritical) for invasion of the segregation infidelity mutant given n drivers. This assumes that there is no cost of the meiotic mutant. (C) Trajectories of meiotic mutants starting at a frequency of 0.1. Note that the X-axis is a log scale.

