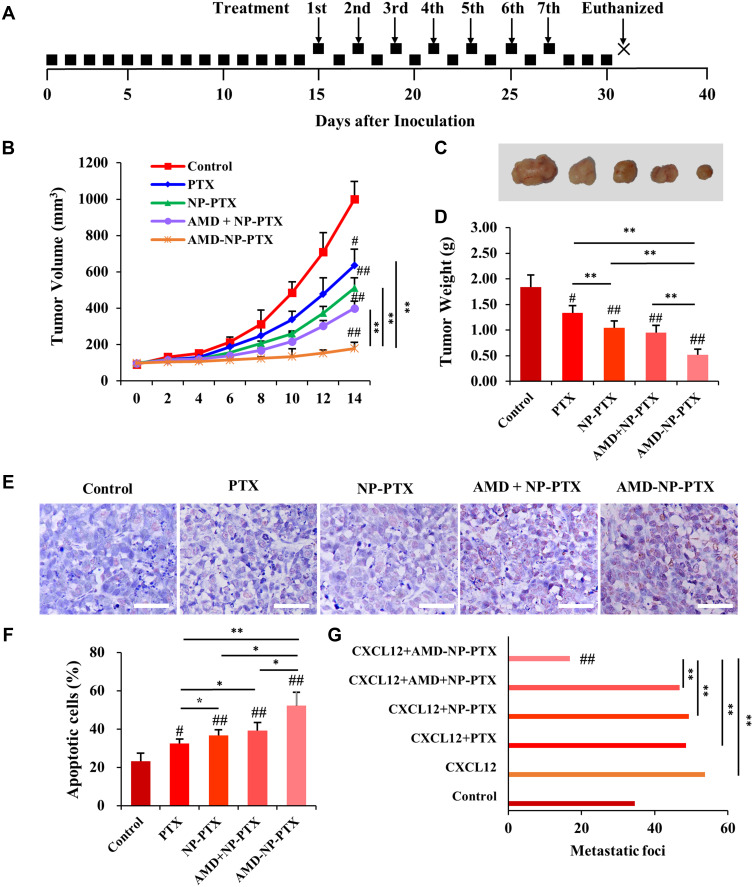
Figure 7.
In vivo anticancer effect of AMD-NP-PTX on ovarian cancer-bearing nude mice. (A) The treatment regimen. (B) The curve of tumor volume change in each group. (C) The tumor nodules were dissected and photographed in each group after treatment. (D) The average tumor weight in each group. (E) TUNEL staining was used to detect the apoptosis of tumor tissue in nude mice. Scale bar=50 μm. (F) Tumor apoptosis cells assessed by counting the rate of TUNEL-positive cells. (G) Number of metastatic foci in different groups. Data are presented as the mean±SD (n=6). #p<0.05, ##p<0.01 (significant difference compared with the control group); *p<0.05, **p<0.01 (significant difference between different treatment groups).

