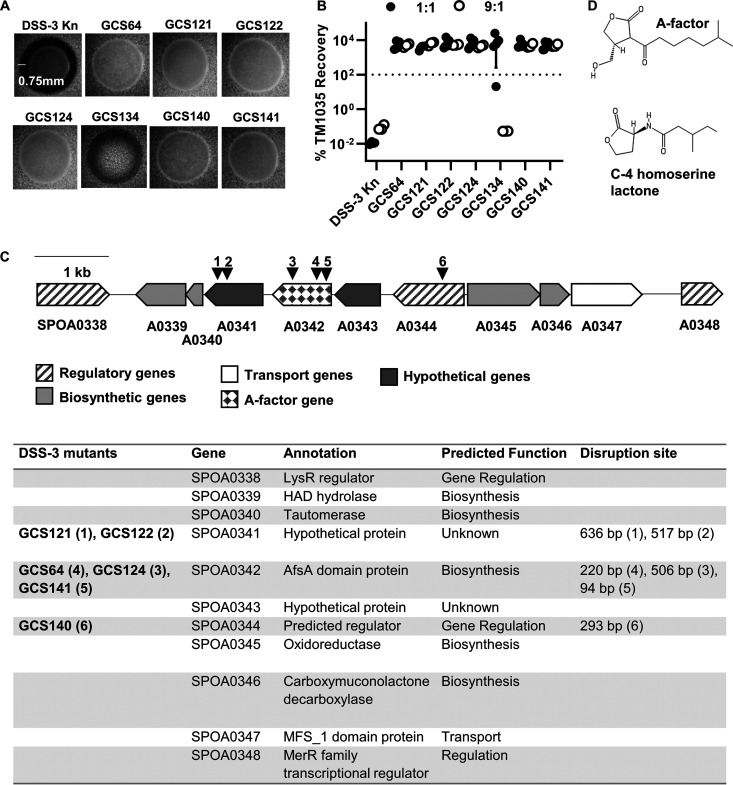
FIG 3.
Characterization of DSS-3 mutants that have lost the killing phenotype. (A) Microscope images of DSS-3 Kn tagged wild type and seven identified nonkiller mutants when grown on fluorescent TM1035 agar overlay plates. Scale bar denotes length of inhibition zone if killing occurs. (B) Percent recovery of TM1035 after 24 h of coincubation with the DSS-3 Kn control or each potential nonkiller mutant at a 1:1 (black circles) and 9:1 (white circles) killer-to-target strain OD600 ratio. Asterisks denote significant reduction (P < 0.05, Student’s t test) compared to the DSS-3 Kn control. Error bars indicate standard deviation. (C) Diagram of putative GBL synthesis gene cluster on the megaplasmid. Black triangles and numbers correspond to transposon insertion mutants listed in the table below. (D) Structures for quorum molecules A-factor GBL and C-4 homoserine lactone.

