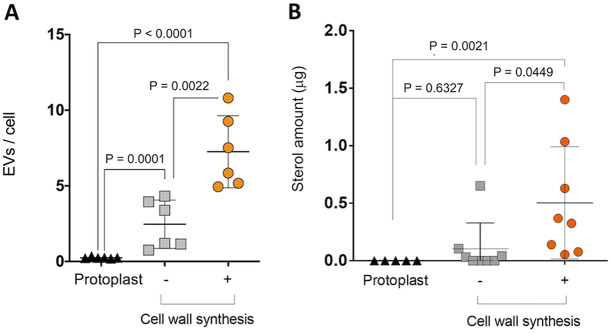
FIG 4.
EV quantification during the cell wall synthesis process in A. fumigatus protoplasts. (A) Quantitative NTA of EVs produced by freshly prepared protoplasts and from protoplasts incubated under conditions of cell wall regeneration or nonregeneration. (B) Determination of sterol concentration in EVs obtained from supernatants of fresh protoplasts, nonregenerating protoplasts, and protoplasts incubated under cell wall-regenerating conditions. In panels A and B, values are reported as means ± standard deviations of results obtained from at least two and five independent experiments, respectively. Paired comparisons were statistically analyzed using the t test tool in GraphPad Prism 6 software.

