
FIG 3.
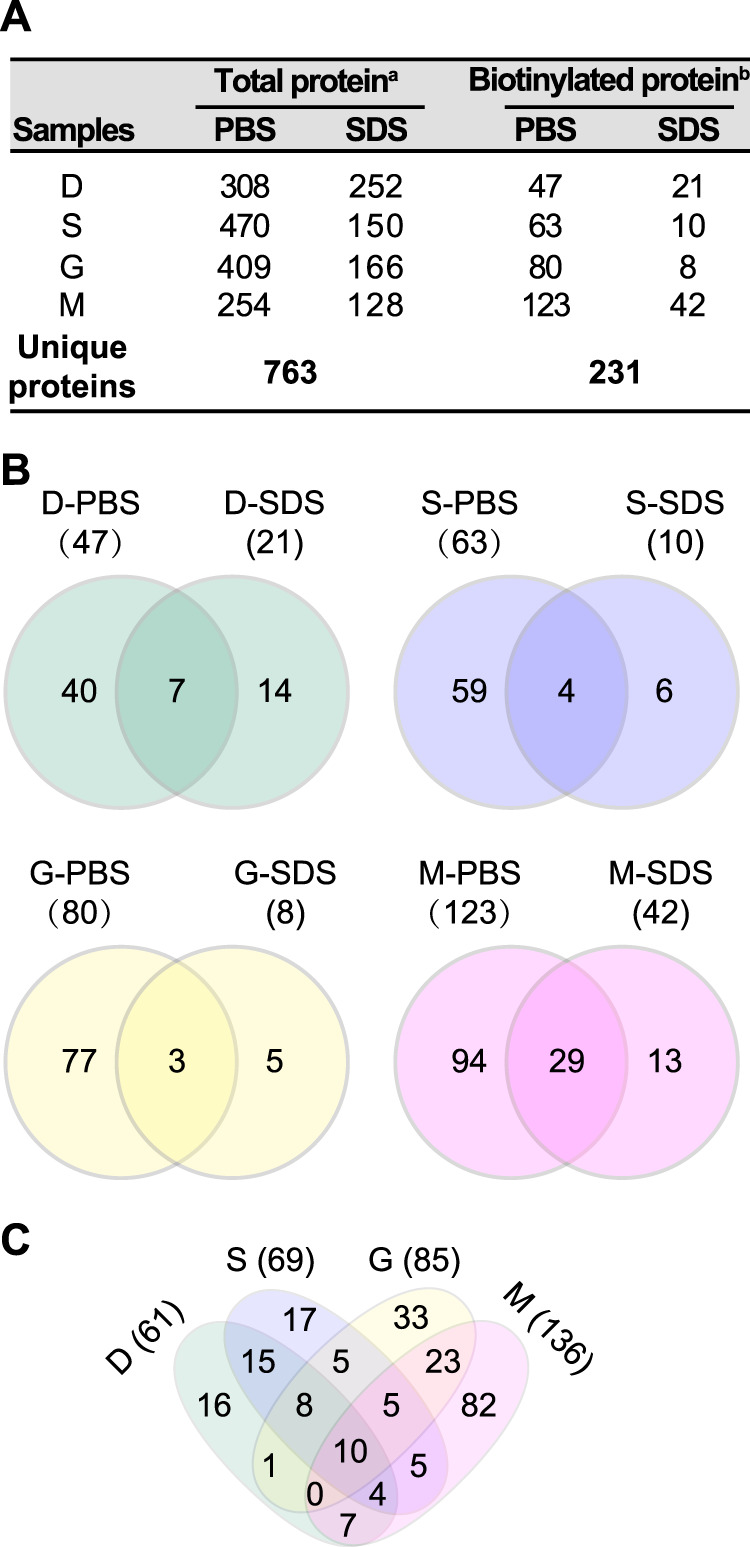
Overview of the surface proteome identified by biotinylation coupled with LC-MS/MS analysis. (A) Number of proteins identified in different samples. Data labeled with a superscript “a” represent numbers of proteins identified by at least two peptides or with numbers of PSMs (peptide spectrum matches) of ≥10. Data labeled with a superscript “b” represent numbers of proteins detected with at least one peptide with biotinylation modification. (B and C) Venn diagrams showing the common and specific surface proteins with biotinylation across different extractions (B) and developmental stages (C).