Fig. 3.

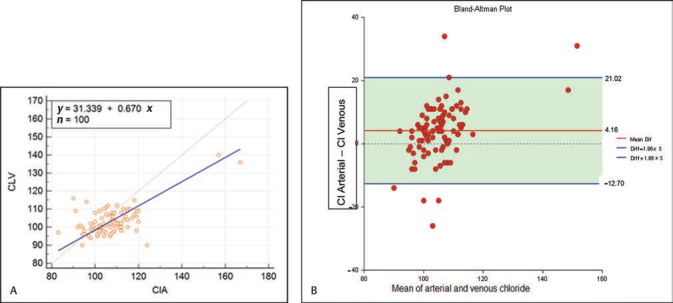
( A ) Deming regression plot between arterial and venous Cl – ( B ) Bland Altman analysis plot of chloride in arterial and venous blood.

( A ) Deming regression plot between arterial and venous Cl – ( B ) Bland Altman analysis plot of chloride in arterial and venous blood.