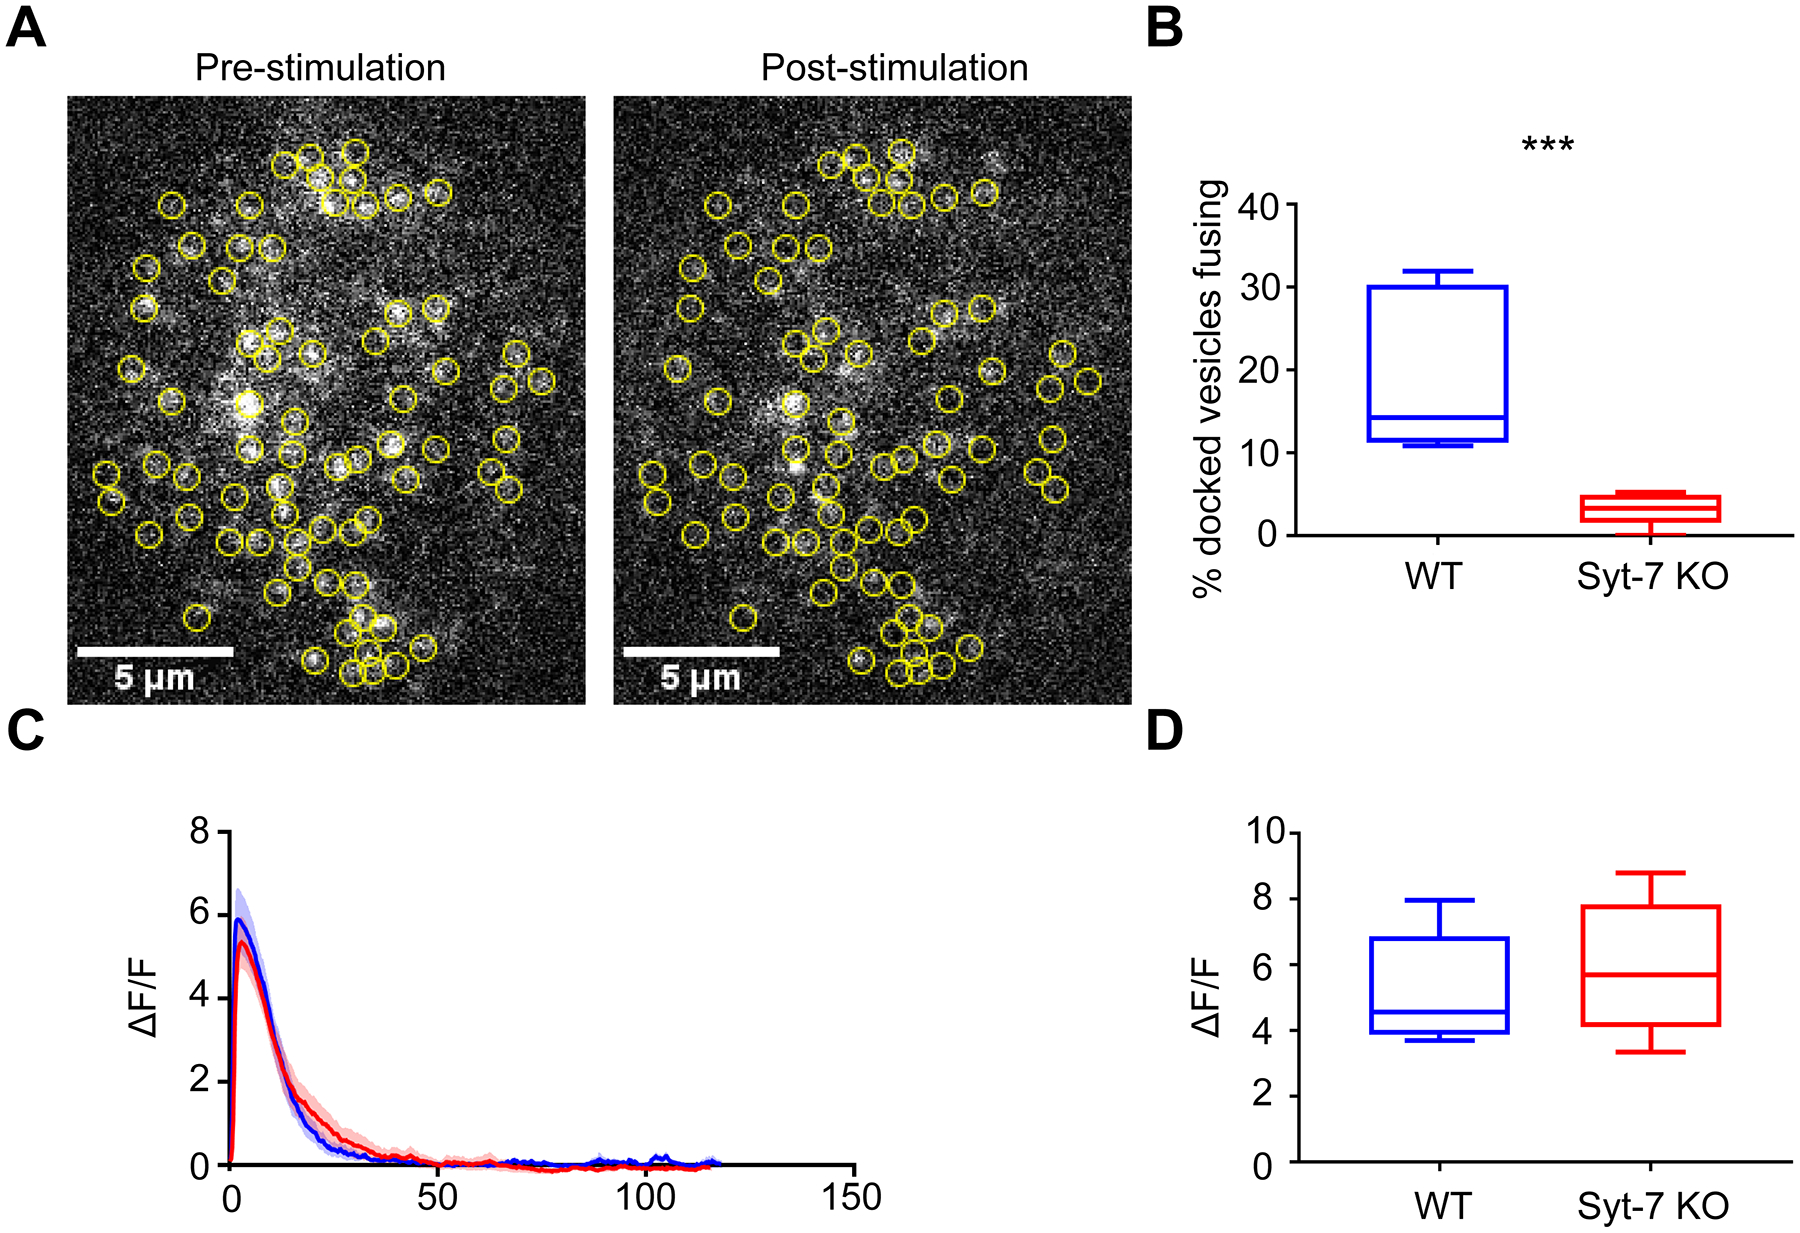
Figure 5. Granules in Syt-7 KO cells stimulated by ACh evince a lower fusion probability than those in WT cells.

WT and Syt-7 KO cells overexpressing GFP-tagged NPY were stimulated with 100 μM ACh for two minutes. Fusion events were observed using TIRFM. A. Pre- and post-stimulation images of fluorescent NPY puncta in a WT cell. Yellow circles indicate the position of granules that fused during the stimulation period. B. Box plot showing the percentage of docked granules that fused in WT (19.1 ± 3.4 %; n = 8 cells; 4 primary cell preparations) and Syt-7 KO cells (3.2 ± 0.7 %; n = 7 cells; 4 primary cell preparations). *** p<0.005, Mann-Whitney test, Brown-Forsythe, p<0.05). C-D. WT and Syt-7 KO cells transfected with GCaMP5G were stimulated with 100 μM ACh for two minutes. Fluorescence was monitored using TIRFM, with ΔF/F was calculated for each cell. C. Average ΔF/F vs. time traces in response to ACh stimulation for WT (n = 7 cells, blue; 5 primary cell preparations) and Syt-7 KO (n= 7 cells, red; 5 primary cell preparations) cells. D. Box plot showing the average value of the peak ΔF/F for WT (5.41 ± 0.62) and Syt-7 KO (5.94 ± 0.76) cells. The average values were not statistically significant (Student’s t-test, p > 0.05). For all box plots, box dimensions extend from the 25th to the 75th percentiles; whiskers represent the minimum and maximum values; line represents median.
