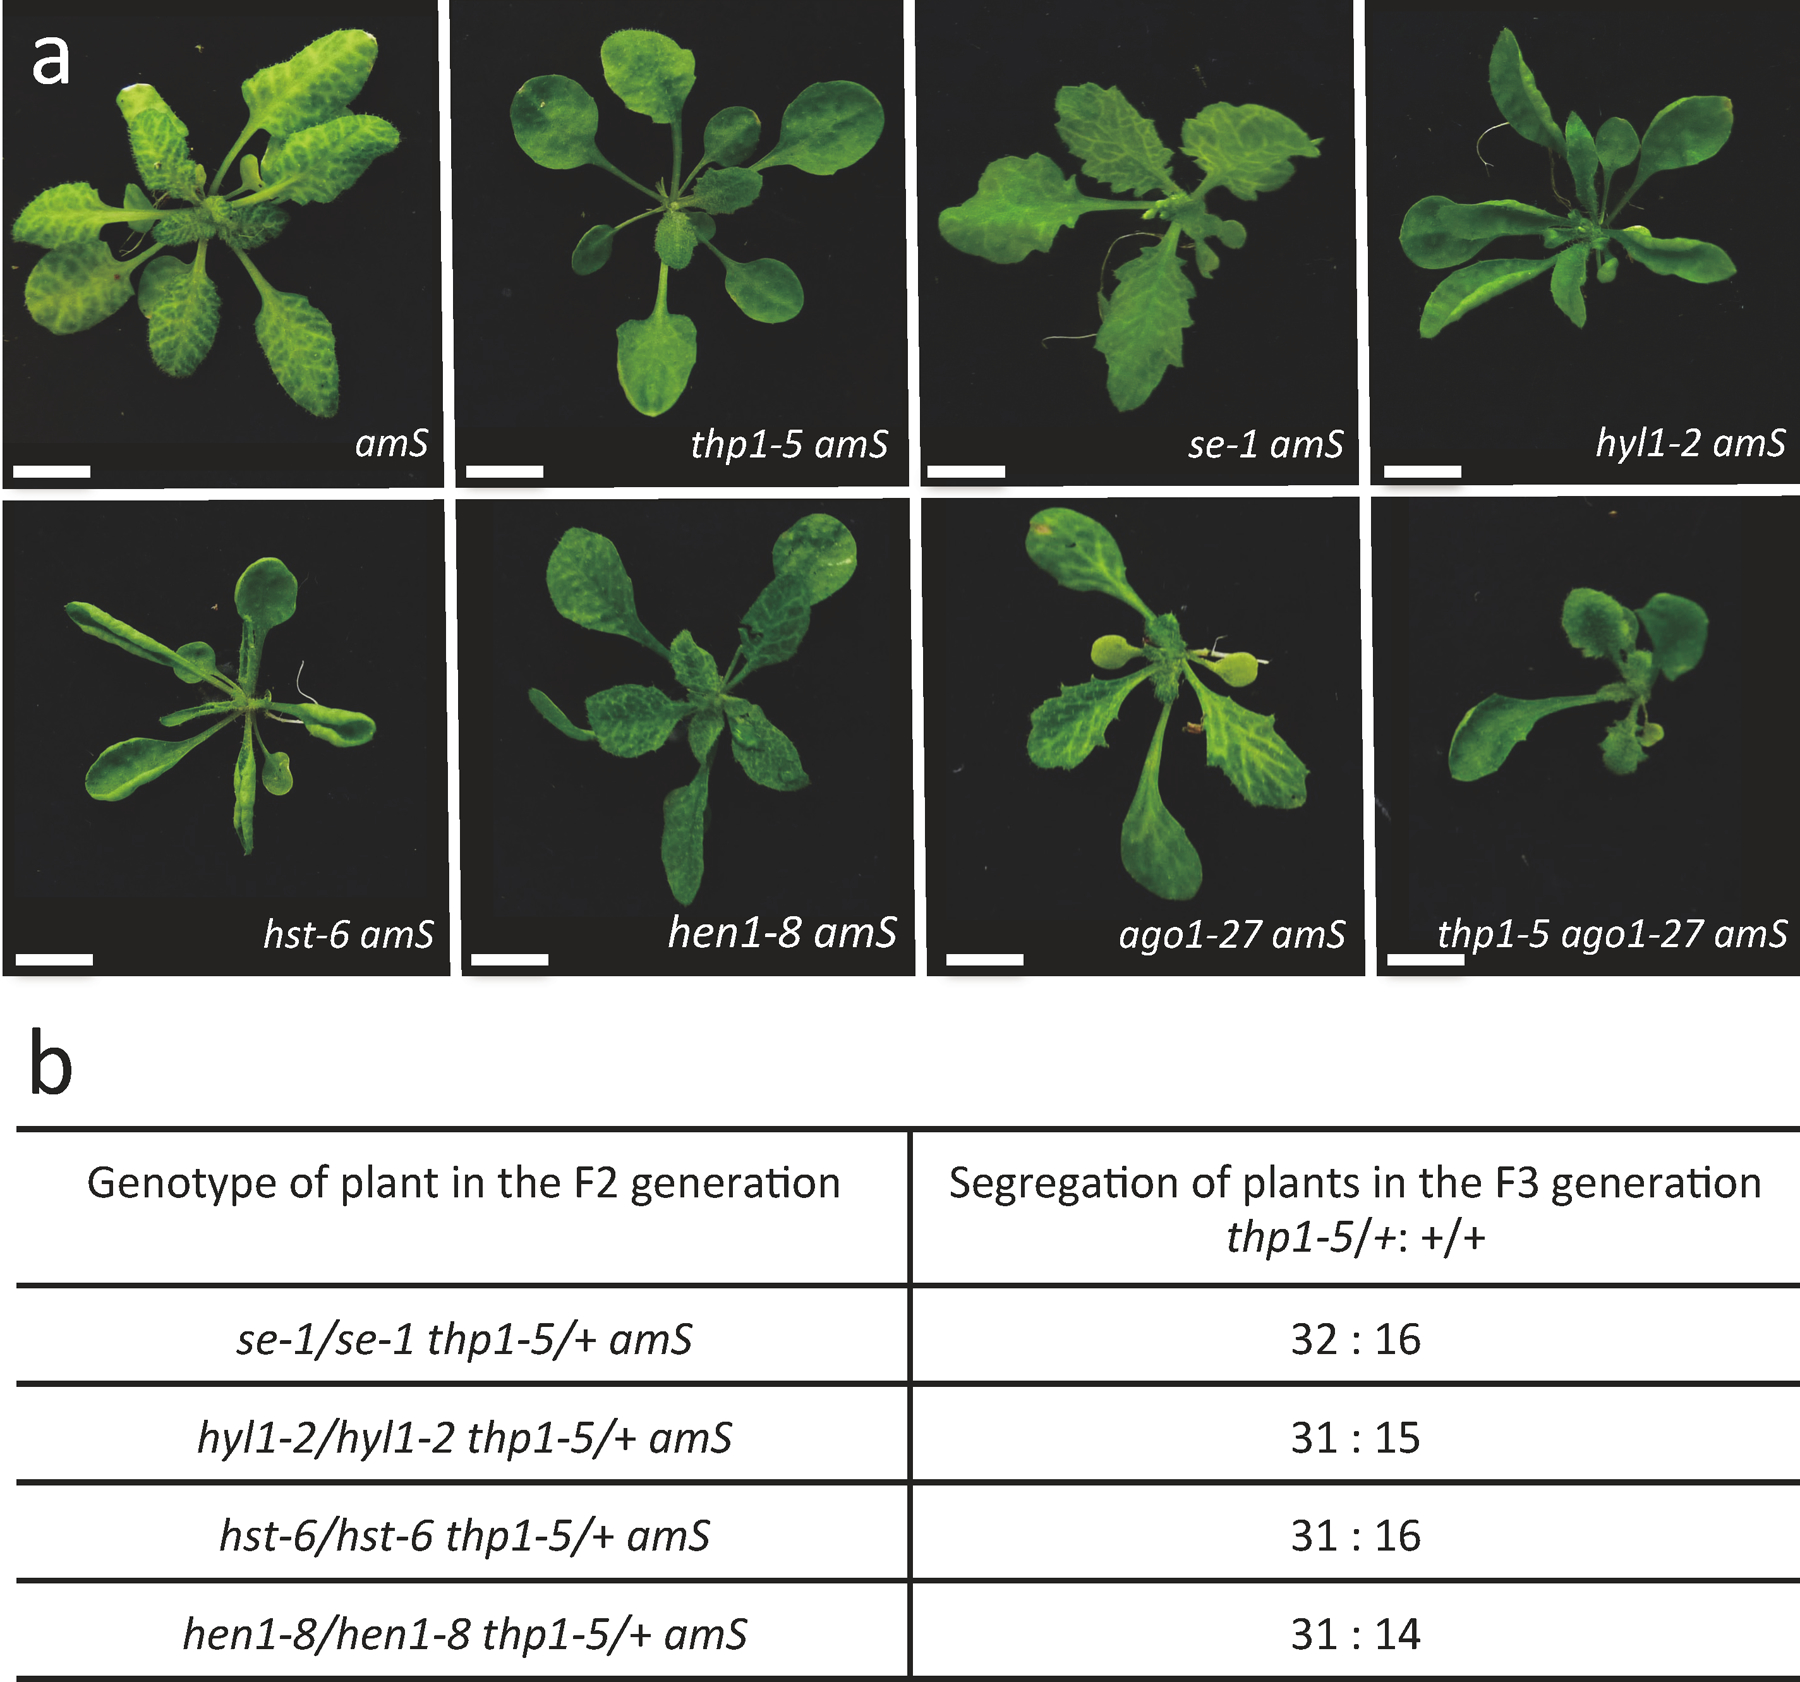
Extended Data Fig. 3. Genetic interactions between mutants in THP1 and miRNA biogenesis genes.

(a) Morphological phenotypes of 25-day-old amS, thp1–5 amS, se-1 amS, hyl1–2 amS, hst-6 amS, hen1–8 amS, ago1–27 amS, and thp1–5 ago1–27 amS plants. Scale bar = 10 mm. All plants with the same genotype exhibit the same phenotype and one representative for each genotype is shown. (b) Genetic segregation analyses. F2 plants of the indicated genotypes were selved and ~48 F3 plants were genotyped for the thp1–5 mutation. The ratios of thp1–5/+ : +/+ are around 2:1, indicating that thp1–5 homozygosity leads to embryo lethality.
