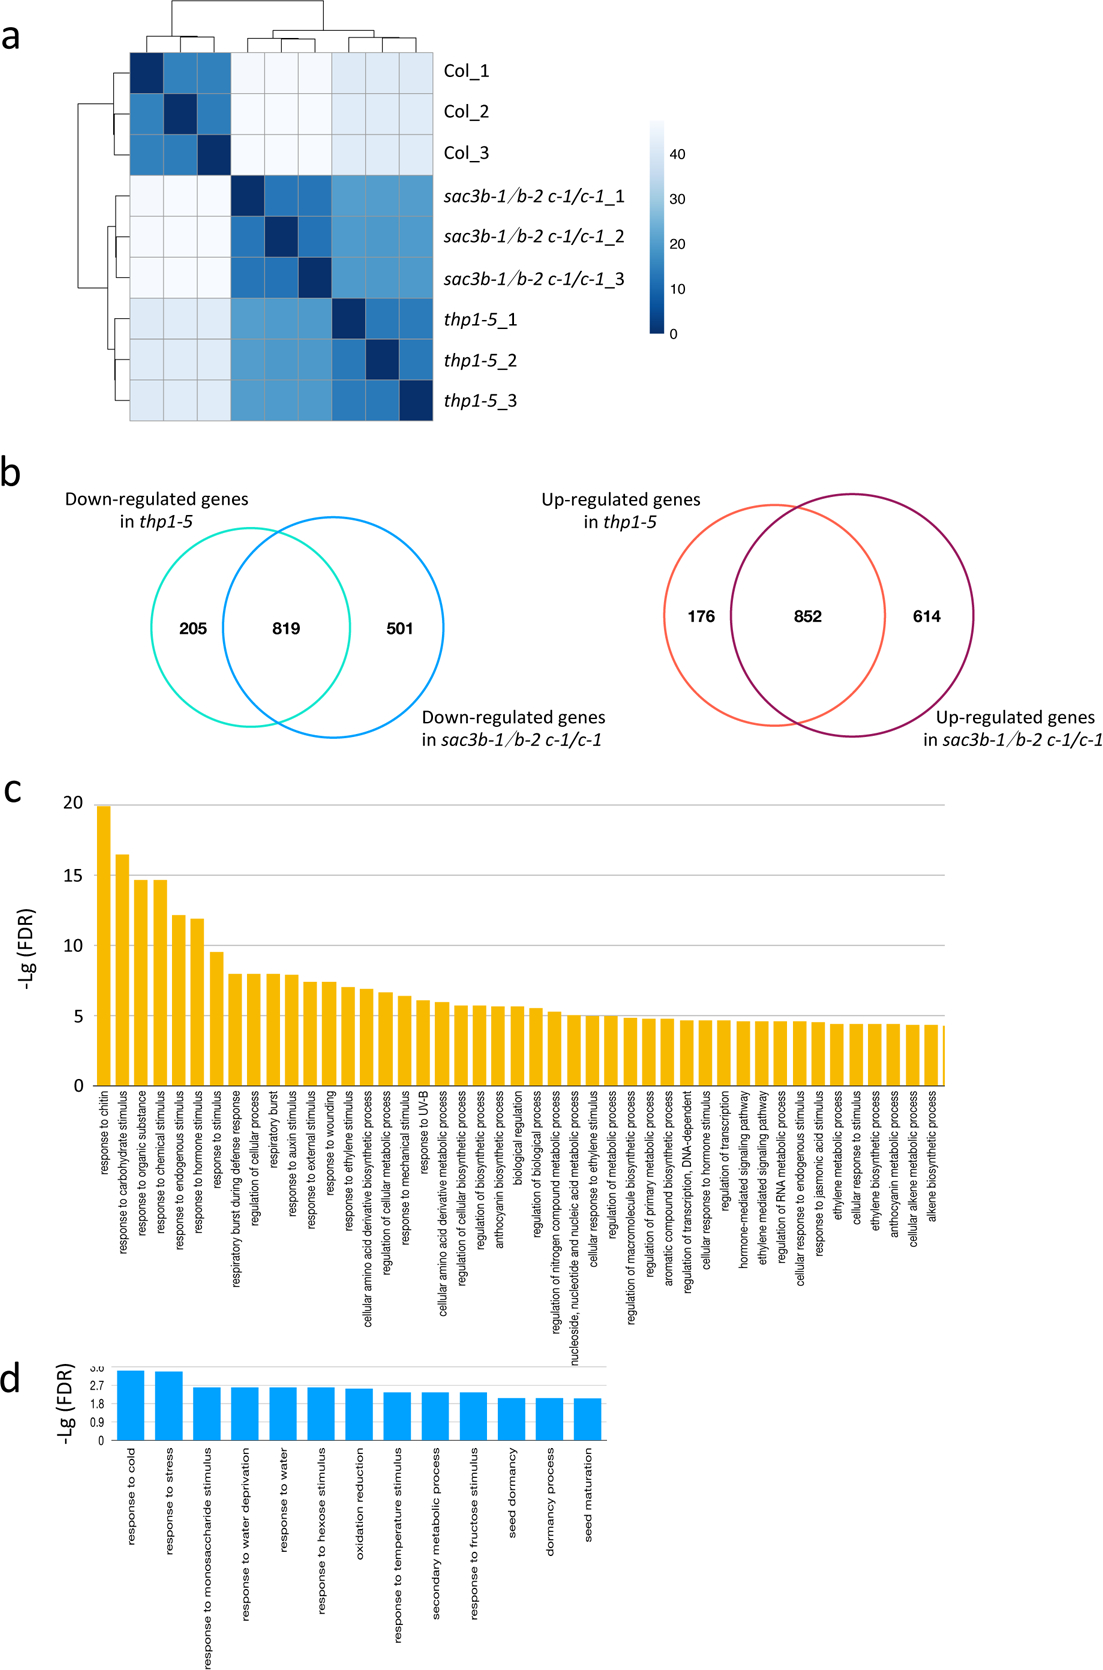
Extended Data Fig. 6. mRNA sequencing of wild type (Col), thp1–5, and sac3b-1/sac3b-2 sac3c-1/sac3c-1.

(a) Correlation analysis across WT, thp1–5 and sac3b-1/sac3b-2 sac3c-1/sac3c-1 samples. The three samples from each genotype are biological replicates. Color density indicates Euclidean distance calculated by log-transformed normalized read counts assigned to each gene. (b) Venn diagrams showing the overlap in down-regulated (left) and up-regulated (right) genes between thp1–5 and sac3b-1/sac3b-2 sac3c-1/sac3c-1. (c) GO enrichment analysis of 852 commonly up-regulated genes in thp1–5 and sac3b-1/sac3b-2 sac3c-1/sac3c-1. (d) GO enrichment analysis of 819 commonly down-regulated genes in thp1–5 and sac3b-1/sac3b-2 sac3c-1/sac3c-1.
