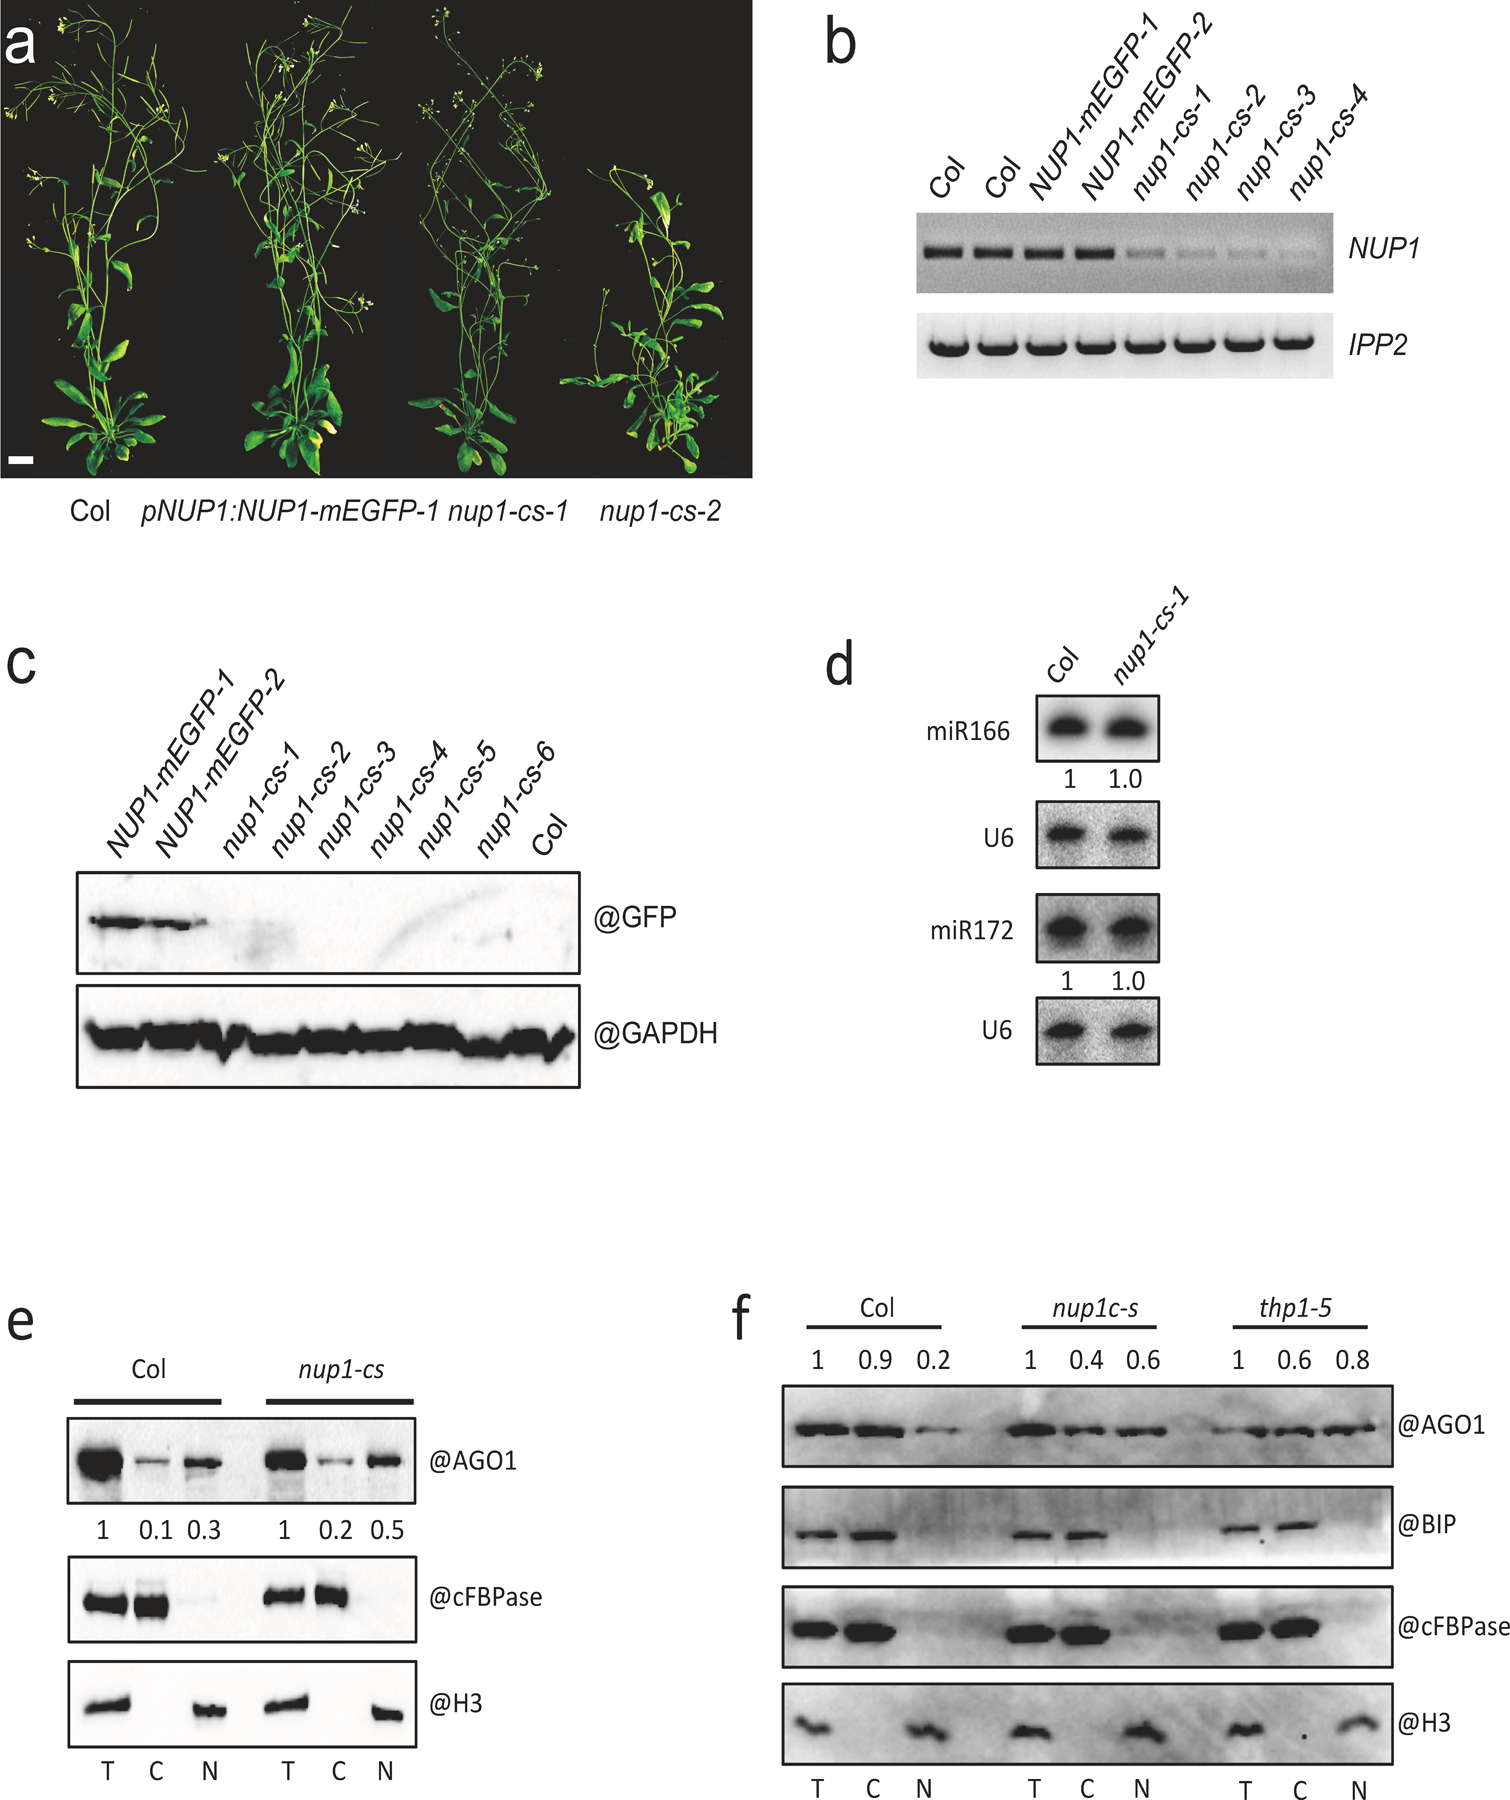
Extended Data Fig. 10. Characterization of nup1-cs lines.

(a) 45-day-old plants of wild type (Col) and three lines harboring the pNUP1:NUP1-mEGFP transgene (the three on the right). Two of the three are nup1-cs (nup1 co-suppression) lines. Scale bar = 10 mm. (b) RT-PCR analysis of NUP1 transcripts in Col, pNUP1:NUP1-mEGFP and nup1-cs lines. Note that the signal represents transcripts from both the endogenous NUP1 gene and the pNUP1:NUP1-mEGFP transgene. The experiment was repeated two times with similar results. (c) Protein gel blot analysis of the NUP1-mEGFP protein in Col, pNUP1:NUP1-mEGFP and nup1-cs lines. The experiment was conducted one time. (d) RNA gel blot assays to determine the levels of miR166 and miR172 in Col and a nup1-cs-1 line. Inflorescences were used for RNA extraction. U6 served as an internal control. The experiment was repeated two times with similar results. (e)-(f) Protein gel blot assays to determine the nucleo-cytoplasmic partitioning of AGO1 in Col and nup1-cs (e) and in Col, nup1-cs, and thp1–5 (f). Three independent experiments gave similar results. The fractions were subjected to protein gel blot analysis using anti-AGO1, anti-cFBPase, anti-H3 and anti-BIP antibodies, respectively. H3 is a nuclear marker; cFBPase is a cytoplasmic marker. They were also used in the quantification of AGO1 levels (represented by the numbers) between T and N and between T and C, respectively. BIP is an ER marker to indicate the level of ER contamination in the nuclear fractions.
