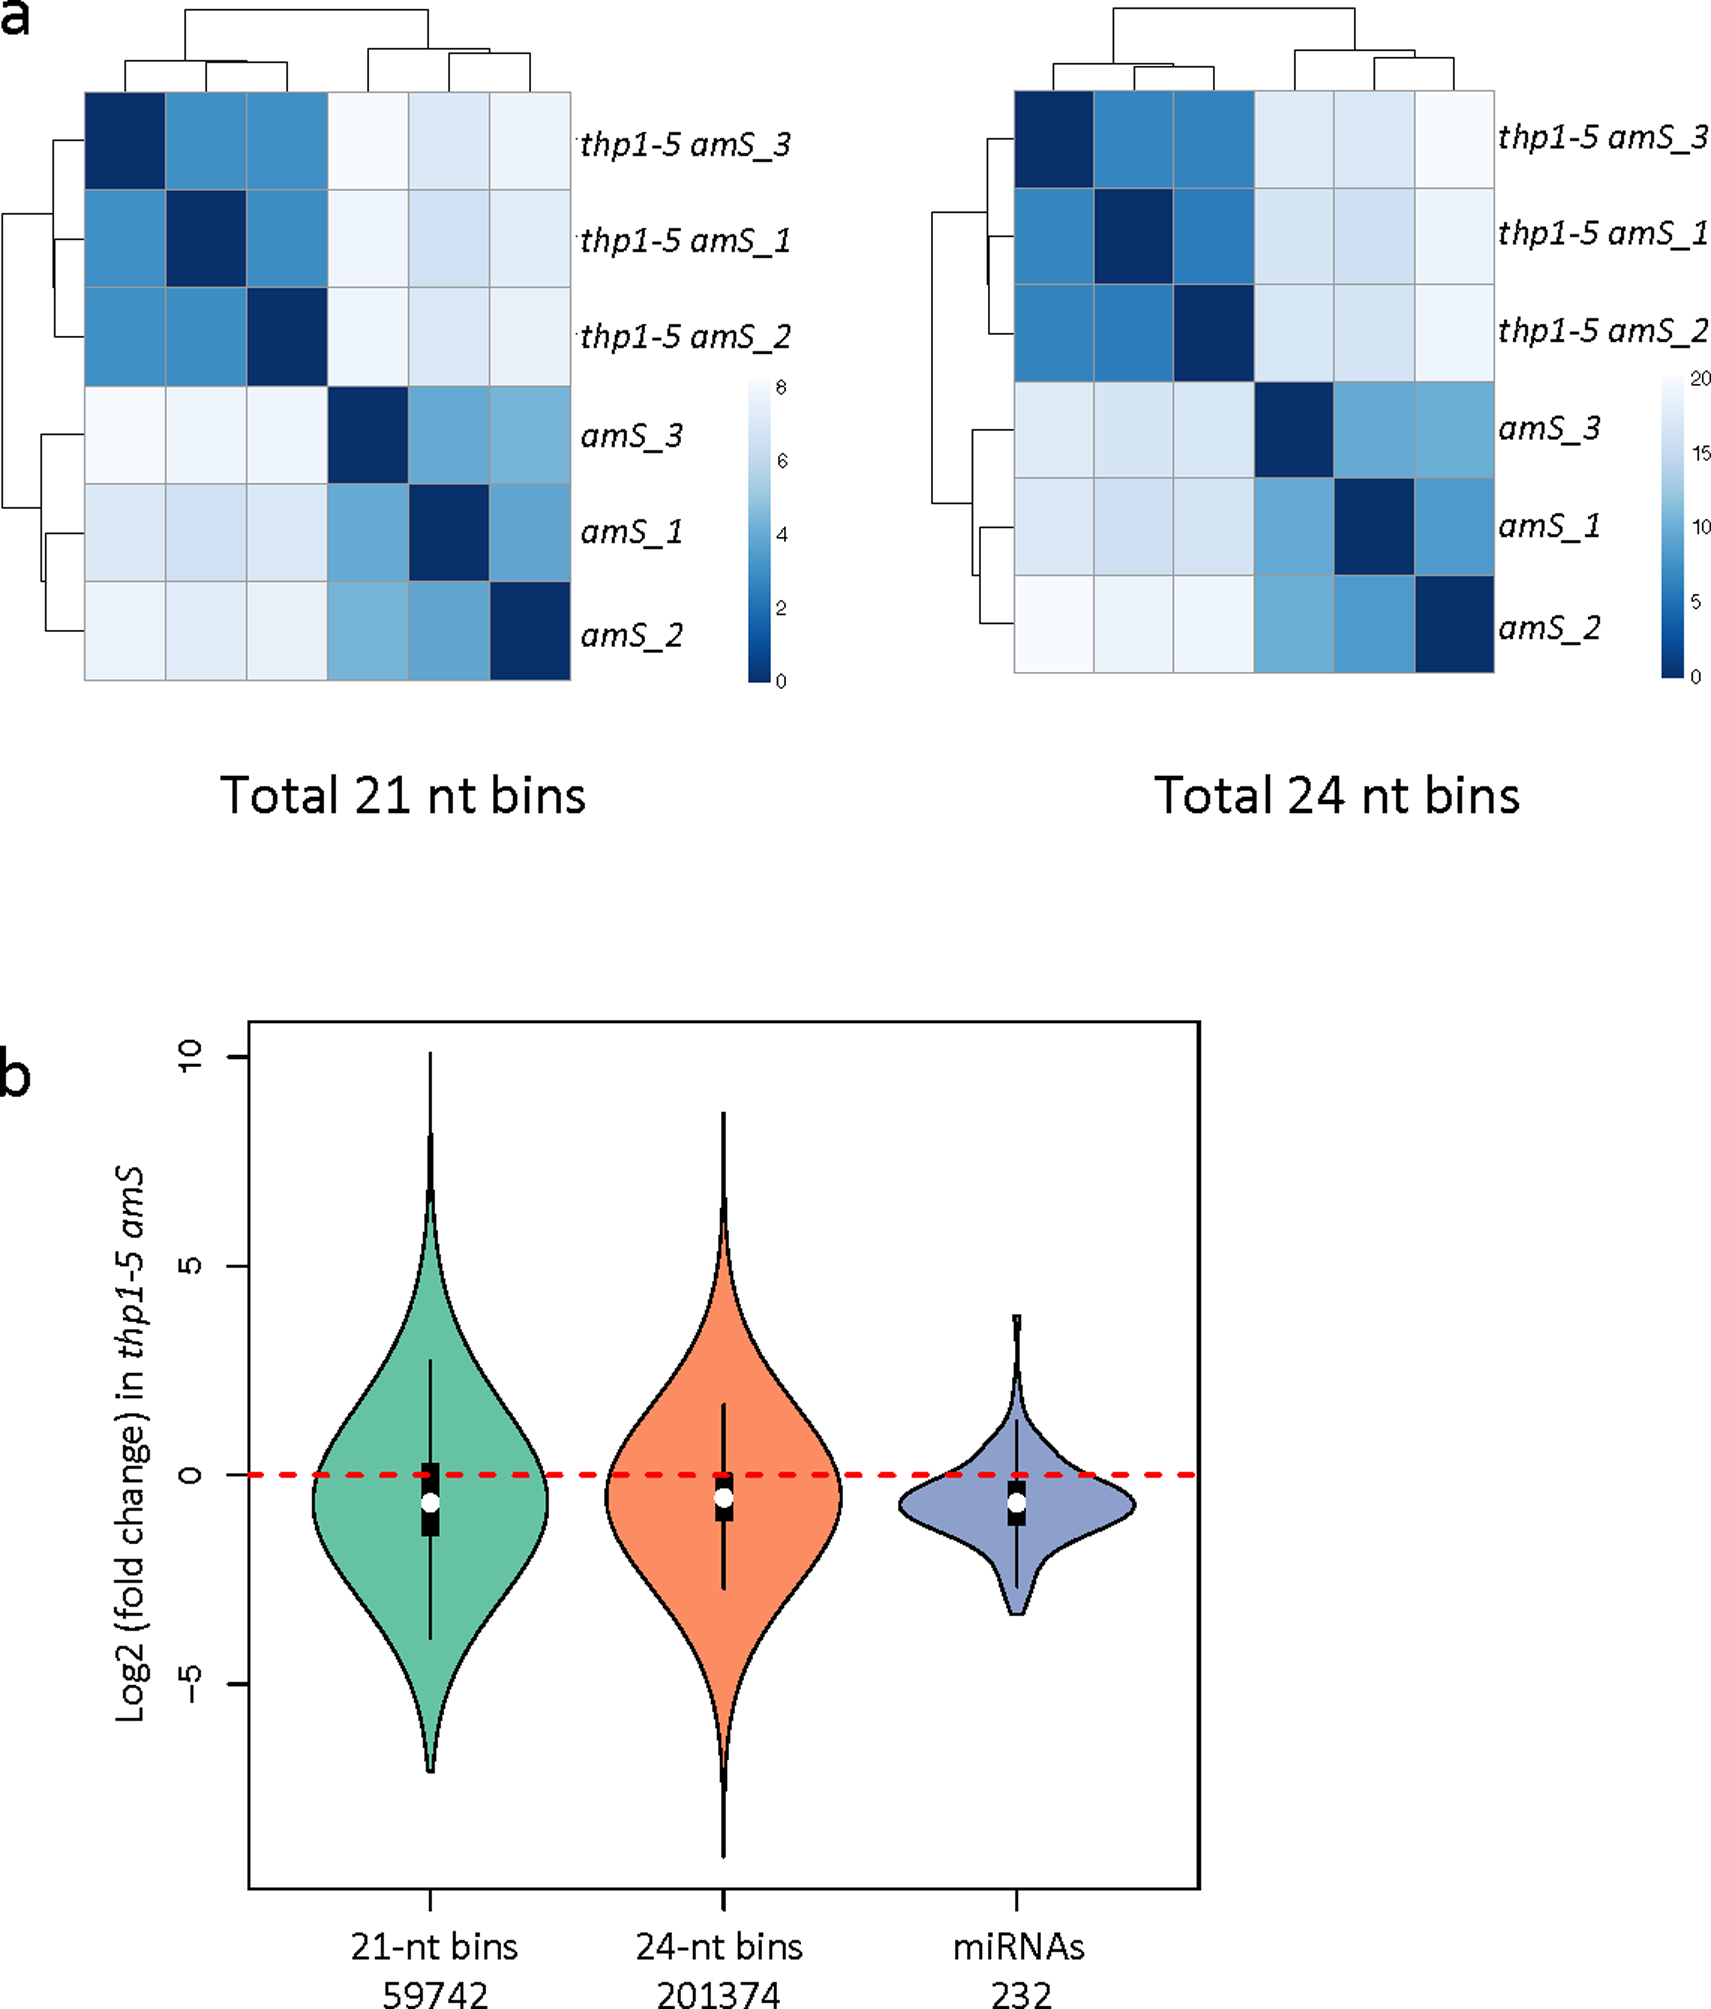
Extended Data Fig. 1. Small RNA sequencing of thp1–5 amS.

(a) Heatmaps to show reproducibility among amS and thp1–5 amS biological replicates. The whole genome was divided into 100-bp bins, and small RNA reads whose 5’ ends located in a bin were assigned to this bin. Color density indicates distance calculated by log-transformed normalized read counts assigned to each bin. (b) Distribution of fold changes for all detected miRNAs (n=232) and 21 nt (n=59742 windows of 100bp) and 24 nt (n=201374 windows of 100bp) small RNAs in thp1–5 amS relative to amS. The lower extreme, the lower hinge, the white dot, the upper hinge, and the upper extreme of the black box represent the minimum, the first quartile, the median, the third quartile, and the maximum of the data. The violin shape corresponds to the density of data. ***, P-value < 2.2e-16. P-values were determined by a paired two-sided Wilcoxon test.
